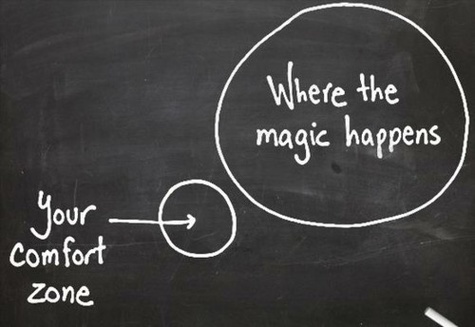
 (c) Flickr | Oklanica (c) Flickr | Oklanica There is this sketch of a Venn diagram with two non-overlapping circles, one being a person’s comfort zone, and the other one showing “where the magic happens”. A few months ago, my advisor sent me to a conference in Salt Lake City that felt exactly like this Venn diagram. While many of my early career co-workers were at a science communication workshop at Texas Tech University in Lubbock, Texas, I was en route to a joint conference on agricultural and forest meteorology, boundary layer climates, and biogeosciences. The areas might not reflect it as much, but I was way out of my comfort zone. 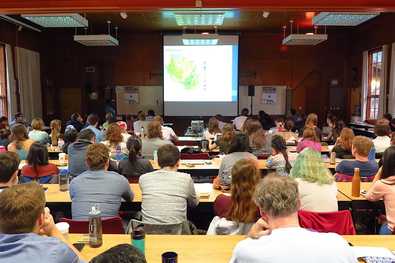 10th Graduate Climate Conference 2016 10th Graduate Climate Conference 2016 And that was not the first time it happened. In October of 2013, I was at the 7th Graduate Climate Conference in Woods Hole, Massachusetts, a fun and relaxed student conference and one of the first conferences I ever talked about my own research idea. The only problem was, that entire sessions were dedicated to super-specific issues, like atmospheric dynamics, ocean biology, or aerosols. The three-day conference had one session on humans, climate, and policy, and a handful of posters about applied research (including my own). That was all. What was I doing at this meteorology nerdfest? (Admittedly, New England in the fall is off the charts beautiful, so at least from a photographic standpoint it was totally worth it!) 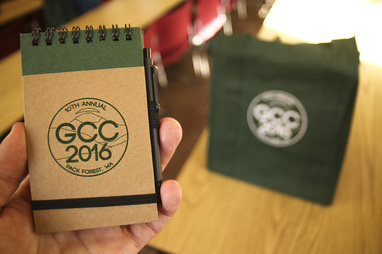 What I didn’t understand in 2013 I learned this summer. After five days of talks about field campaigns, flux experiments, and instrument calibration, I understood that this work is not just essential in understanding how our atmosphere works or how plants react to global warming. This research can be the foundation of seasonal climate forecasts that researchers like me use to make decision tools for farmers. As an applied, interdisciplinary researcher, I should be outside my comfort zone. My job is not only to understand what users want and how decision tools that researchers like me try to create are used (or not used). I also need to understand the work of modelers, statisticians, agronomists, or anthropologists, to apply their methods, to better judge which climate models or statistical techniques work best for me, to appreciate their work, or simply to speak their language and understand their way of thinking. Afterall, I might be using their work for my research, or even more so be there future collaborator. 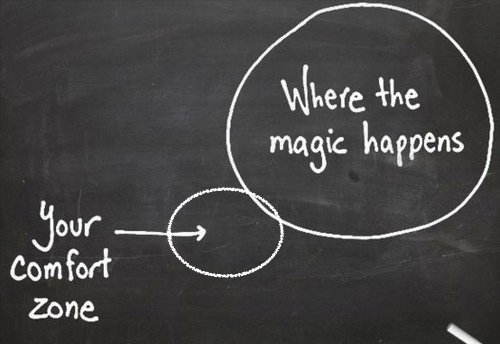 This weekend, I am again at the 10th Graduate Climate Conference, this time in Washington state, presenting (again for one of the first times) results from my research. But between log cabins and cedar trees, this feels like a lesson-learned check. I’m still struggling to make sense of concepts, acronyms, and jargon, but not as much as I used to. My comfort zone became a little bigger. And as I’m listening I realize that these brilliant, creative, engaging, fascinating minds not only shape tomorrow’s climate research. They might also be the people I’ll be working with sooner or later.
Check out: www.graduateclimateconference.com 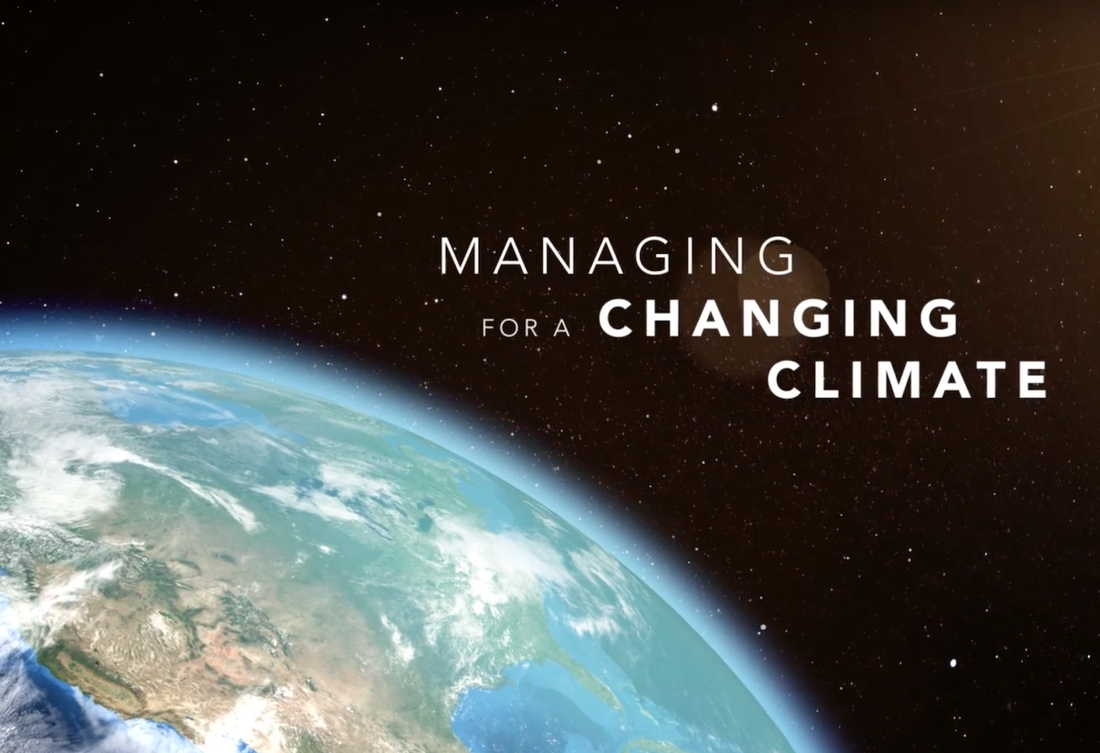 Screenshot Screenshot This post was originally written for the Early Career Climate Forum and posted in August 2016. Earlier this year, I wrote an ECCF blog about a fall semester undergraduate class at the University of Oklahoma (OU) that taught students about climate science, the impacts of climate change, and that gave them a look behind the scenes of the climate negotiations at the Paris COP21 meeting last December. Well, I’m happy to report that this fall this class is back — and it’s gotten even better. Starting August 17th, the South Central Climate Science Center (SCCSC) will be offering “Managing for a Changing Climate”, an interactive class based on the experiences and feedback from last fall. “Participants will hear from a wide variety of experts from both the research and management worlds”, says Aparna Bamzai, University Assistant Director at the SCCSC and coordinator of the course. They will teach lessons about the components of the climate system, including the range of natural climate variability and external drivers of climate change, in addition to impacts of a changing climate on sectors such as the economy, policy, ecosystems, and indigenous populations. 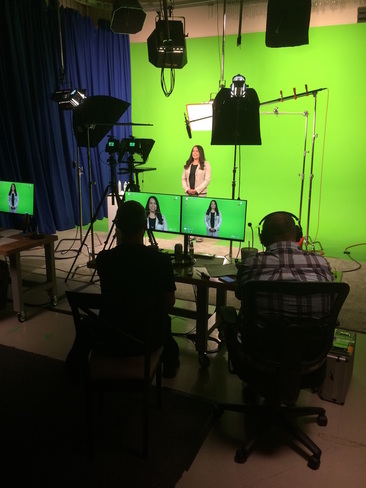 (c) Toni Klemm (c) Toni Klemm The best part: this year the class will be available not just to OU students but also — for free, thanks to funding from USGS and NASA — to natural resource managers, tribal environmental professionals, and anyone else who is interested in the science and impacts of climate change, because almost everything will take place online, on OU’s interactive learning platform Janux. Professionally produced videos will feature experts from across the south-central U.S., and participants will conduct readings and discussions on the online course page. All participants will be evaluated through online quizzes, while university students enrolled for credit will also produce individual term papers and — similar to the class last fall — a group project culminating in a mock negotiation of the United Nations Framework Convention on Climate Change. 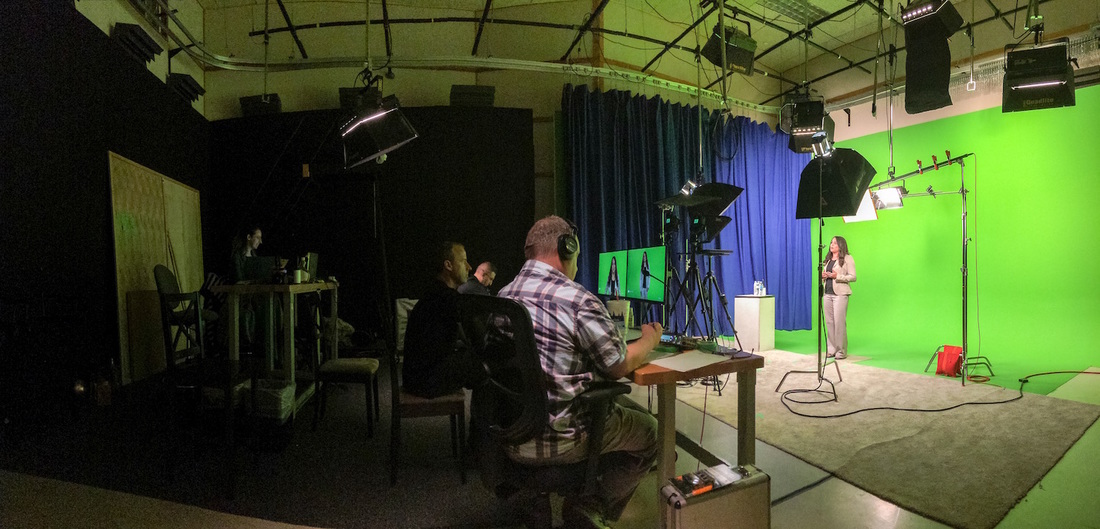 (c) Toni Klemm (c) Toni Klemm To produce the class videos, the SCCSC teamed up with Next Thought, a company that specializes in online education and produces all of OU's online classes. On the course website, videos and other online content will be released successively as the semester progresses instead of all at once. That way class and online participants can engage in discussions about the same course material. The class is open to enroll at janux.ou.edu. I will participate as one of the online students. I’m excited about this class, because it will bridge the gap between different fields: science, management, and policy-making. If you plan to enroll in the class and what to share your experience in a guest blog post during or after the semester, please let us know via email at [email protected] or through Facebook or Twitter.
Development of this course was funded by the USGS through the South Central Climate Science Center on Grant #G15AP00136, NASA through the Oklahoma Space Grant Consortium on Grant #NNX11AB54H, and the University of Oklahoma College of Atmospheric and Geographic Sciences. The contents of this course are solely the responsibility of the authors and do not necessarily represent the views of the funding agencies. This post was originally written for the Early Career Climate Forum and posted in May 2016.
I recently finished an online survey of agricultural advisors in Texas, Oklahoma, Kansas, and Colorado about seasonal forecasting for winter wheat farmers. Online surveys are everywhere these days, and with free tools like SurveyMonkey or Google Forms, anyone can conduct a survey. Preparing and conducting a survey for research, however, is no small endeavor and requires careful consideration. My survey, for example, took 3 months to plan and another 3 to conduct. Here are 6 tips on how to get the most out of your efforts. 1. Survey or something else? Ask yourself: What information am I interested in, and is a survey the best method to get that information? Surveys work well with quantitative information that can be ranked, listed, counted, or compared on like-dislike scales. But surveys are not good for qualitative research, like descriptions of events, detailed anecdotes, or open-ended conversations. For this kind of information, personal interviews are a better tool. Analyzing interviews – conducting, recording, transcribing, and analyzing text – is also much more labor-intensive–one reason why interview studies generally have fewer participants than survey-based studies. The pros and cons of qualitative approaches are nicely laid out in Berg (2008, full references at the end of this post), a seminal book on qualitative methods. Babbie (2014) provides the basics about survey research (chapter 9) and quantitative analysis (chapter 14). Also, discuss your approach with faculty, experienced coworkers, and your committee. I decided that a survey followed by a small number of interviews would give me the best of both worlds – a large, quantitative dataset to analyze and detailed information to explain some of the most interesting survey results, all while being time-efficient. 2. Survey methods You’ve established that a survey is your method of choice. But which survey method should you choose? Many surveys today are conducted online as opposed to via phone or snail mail, and for obvious reasons: Online surveys are easy to disseminate – via email or social media – and they are cheap or free to produce (try Google Forms or SurveyMonkey). Online surveys also deliver instant results in a digital format, reducing errors from digitizing mail responses. They also have lower labor costs than phone surveys while having higher response rates: about 25% for online surveys versus 8 to 12% for phone surveys, according to FluidSurveys. Online surveys, as convenient as they are, can create biases. Your target population might not all have internet and/or social media access, or you might not have a complete email list. These biases could lower the explanatory power and generalizability of the survey results. Biases can’t always be avoided, or avoiding them could increase costs. In any case, these limitations should at least be mentioned in the publication. My survey, too, faced the problem of internet bias, but instead of changing my method I decided to change the survey population. Instead of surveying farmers, a group that doesn't use computer and internet much, I surveyed corporate extension agents, agricultural advisors with desk jobs, internet access, and publicly available email addresses. They are also in contact with many farmers in their county, and thus can, to a good degree, speak for them. I couldn’t ask them quite the same questions that I would have asked farmers, but that was a compromise I was willing to make. 3. Survey Design Ask yourself again: What am I interested in? This should help you decide what question formats are best: matrices, multiple choice, open-ended text boxes, Likert scales, images and sketches …? Text books can give you some direction, but think critically about what you read in papers. Was that really the best way to answer the research question in that particular case, or was it just convenient? Could I do it differently and get better, more robust results? Discuss your ideas with your committee or peer researchers. My survey was modeled after focus group and interview research of corn farmers in the Midwestern U.S., which I adapted to fit my time budget and to answer my research questions. Surveying also means explaining differences in responses and, often, trying to confirm or reject a hypothesis. Why did some participants answer in this or that way? Because of their income, their level of education, their geographic location — whatever it is, make sure you ask about it in your survey in order to later cross-tabulate answers and analyze them for significant differences. Also, think about the order of your questions and if you really need to ask all of them. People might be okay spending 10 or 15 minutes on your survey, but too many questions will make them frustrated and tired. Keep it succinct, but still ask everything you need. Let people know at the beginning how long the survey will take (pretests can help you estimate that) and include a progress bar if you can. 4. Question Language By now you probably see that developing a survey takes some time. After weighing the pros and cons of the question format, phrasing, testing, and refining your questions can take weeks or even months. Which words should you avoid? The farming community in the Southern Great Plains, for example, don’t like terms like “sustainability” (which many associate with more government regulations) or “climate change”, for obvious reasons, so I tried to avoid them. Jargon is okay to use, but make sure people understand what you mean. Consult experts to fine-tune the wording. Make sure questions are unambiguous, easy to understand, and check that answer choices cover every possibility. Again, pretesting can reveal most of these issues before you release your survey. The easier you make it for your participants, the more likely they will finish your survey. 5. IRB Approval Getting your survey approved by your Institutional Review Board (IRB, also called Independent Ethics Committee, IEC) is required for all research on human subjects (meaning survey, medical, psychological, and other research on humans) that is intended for publication. You can read more about the IRB here, but in general, the IRB’s job is to make sure you treat your participants fairly, protect their information, and don’t harm the reputation of your university. The University of Oklahoma produced a series of short videos to explain the IRB approval process. Expedited IRB approval for low-risk studies, like in my case with the agricultural advisors, can take be dealt with in one week. If your survey population includes children, prisoners, or pregnant women (so-called “vulnerable populations”), a full panel review is necessary, which can take months, and reviewers might ask you to explain and justify just about every detail in your survey. Some studies need approval by multiple IRBs, for example studies of Native American tribes, which may have their own IRB process. Last but not least, make sure your survey is finalized when submitted for IRB approval. Even small changes, for example in the wording of questions, have to get approved again. 6. Distributing your online survey Congrats! Your survey got IRB-approved and is ready to go. Now to getting your survey out there. Depending on your target population, this can be a challenge for several reasons. For my survey of agricultural advisors, for example, I couldn’t spread it via Facebook or Twitter. I wouldn’t know who took the survey, nor would it be the best way to access my target population. My results would become meaningless. In my case, personal email and email lists were the only method that made sense. There are several ways to increase the number of responses. Connect with your survey population by attending their meetings and introducing yourself. Reach out to trade publications and ask if they would report about your research and the survey you are conducting in their circulation area. When they do, you can link them in your survey invitation. My research was reported by the Kansas Farm Bureau and the Texas Farm Bureau, which I mentioned in survey reminder emails. Especially for out-of-state surveys, this can create trust among the people who are otherwise unfamiliar with you. “Local champions,” people well known and respected by your target group, can also help you boost your response rate. I asked state and regional extension directors to send out invites and reminders on my behalf. Their name in people’s inbox (as opposed to my) most likely made people more likely to take time out of their busy schedule and take my survey. One time I sent out reminders myself. I got zero responses. But local champions are busy people, too. Provide them with email templates, a list of email addresses (semicolon-separated, so they can be copy-pasted into an email address field), and a PDF with information about your research they can attach. Also, ask them to copy you in their email. That way you know the email was actually sent out and when. Collaborating with local champions will be additional work for you, but it is worth the effort. Without them I would not have gotten the response rate that I got. After three months of surveying and several rounds of emails, it was at just over 40%. And as a nice side effect, I had several people say they were very interested in presenting my results. Lastly, timing is critical. Think about times when people are easier to get a hold of. Winter wheat advisors have a lower workload during in the cold months of the year, before temperatures increase in spring and farm work picks up again, which leaves more time for them to do my survey around winter and early spring. Related Material: Babbie, E. R. (2014). The Basics of Social Research (Vol. 6). (especially chapters 9 and 14) Berg, B. (1998). Qualitative Research Methods for the Social Sciences. Third Edition. Edit (August 2017): Pew Research published a comprehensive guide to designing public opinion surveys: http://www.pewresearch.org/methodology/u-s-survey-research/questionnaire-design/ This post was originally written for the Early Career Climate Forum and posted in February 2016. Climate negotiations, like last December in Paris, are complex, complicated, and not always fruitful. Last year, an innovative class for undergraduates at the University of Oklahoma gave students hands-on experience of how climate policy is made. This fall the class will go online for everyone around the world to participate. Here is my interview with the instructor and students of this class to summarize their experience with context to the recent Conference of the Parties (COP21) negotiations. Last December, 195 countries came together at the climate negotiations in Paris to shape a policy agreement on greenhouse gas emissions reduction to keep the global temperature rise below 2ºC. Now imagine this: young men and women armed with laptop and paper full of notes and scribbles, arguing about renewable energies, emission reductions, and carbon taxes across tables with signs that say “Egypt”, “Australia”, “China”, or “Tuvalu”. What sounds like one of the sessions in Paris was actually a classroom setting, the highlight of an undergraduate geography class at the University of Oklahoma (OU) called “Managing for a Changing Climate”. The class, co-taught by staff and researchers of the South Central Climate Science Center (SC CSC) and faculty at OU, featured an interdisciplinary mix of human and physical geography, climate science, climate policy, and economics. Dr. Renee McPherson (one of the instructors of the course) explained that one of the goals of the class was to get the undergraduates more familiar with how climate policy is made, and why sometimes there is an agreement, like last December in Paris, and why sometimes there isn’t, like in 2014 in Lima (where last year’s climate conference was held). McPherson is the University co-director of the SC CSC and an Associate Professor in Geography at OU. She attended both the Paris conference last year and its predecessor in Lima (2014) as an observer. “Policy isn’t this quantitative process, that if you go through step one, step two, step three, you’re always going to get an agreement at the end.” 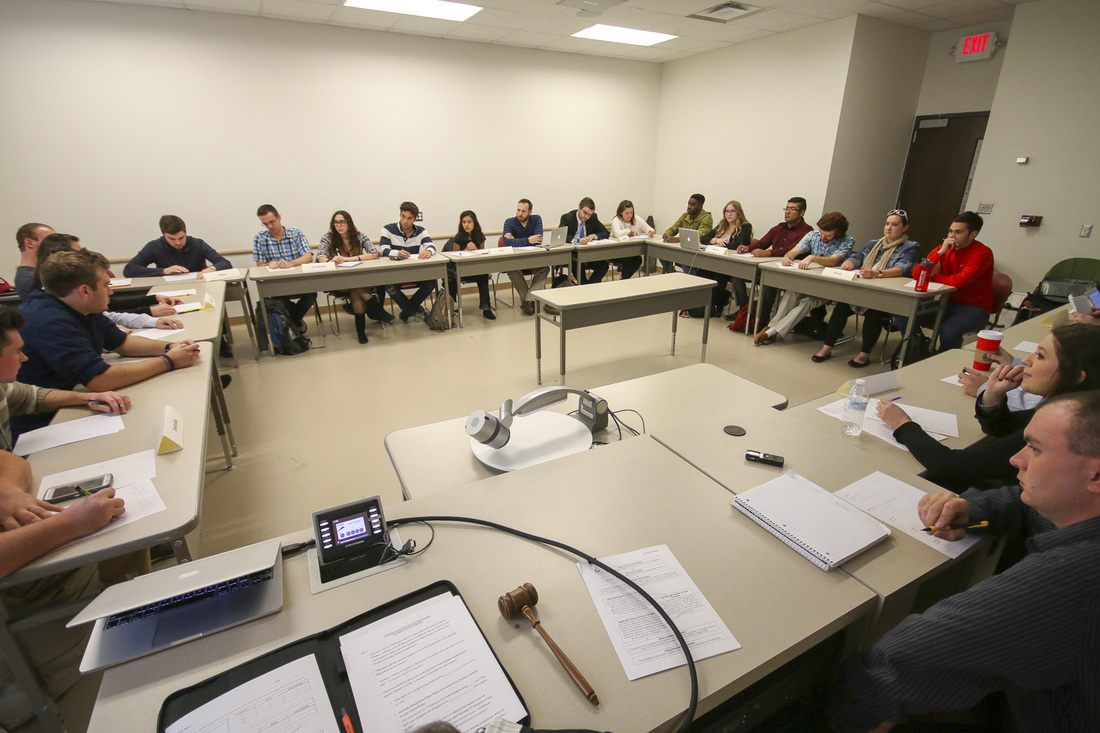 (c) Toni Klemm (c) Toni Klemm Leading up to its own (mock) conference, the class focused on hands-on experience in climate policy, but also featured traditional lectures on economics and climate science. In addition to lectures, students were assigned into teams to represent one of ten countries. Students researched the culture and background of their country to determine which one of the three prescribed policies – renewables, lower emissions, or carbon taxes – to advocate for and defend in a mock climate conference at the end of the semester. “The science has gotten better over the years, and more and more policy leaders are convinced by the science,” says McPherson. Indeed, last year’s negotiations were not so much about whether the climate science was real but what to do about global warming, how to work the problem, said Reid Detchon, Vice President for Energy and Climate Strategy at the United Nations Foundation, in a recent Climate Voices webinar. 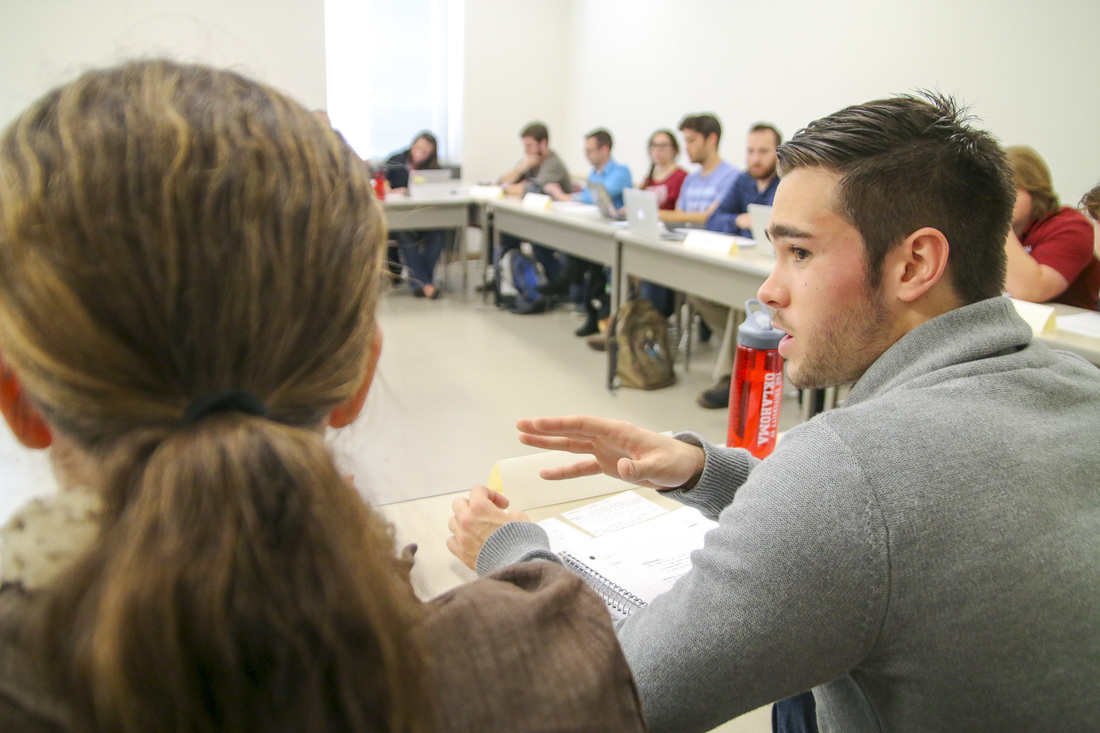 At the end of the semester each of the 10 countries makes a pledge about their contributions… Photo: Toni Klemm At the end of the semester each of the 10 countries makes a pledge about their contributions… Photo: Toni Klemm For Cameron Conyers, a junior majoring in Environmental Sustainability, the mock negotiations made it a “top-notch class”. Teams didn’t just establish their own position, but also considered everyone else’s strategy in order to form stronger alliances. “No one wanted to be the loser”, he remembers. “We looked at targets of each of the other countries, met with their representatives, even outside of class, and hashed out side agreements to pull them onto our side.” At the end of tough negotiations, 9 out of the 10 countries voted for investing in renewable energies, and one voted for carbon taxes. 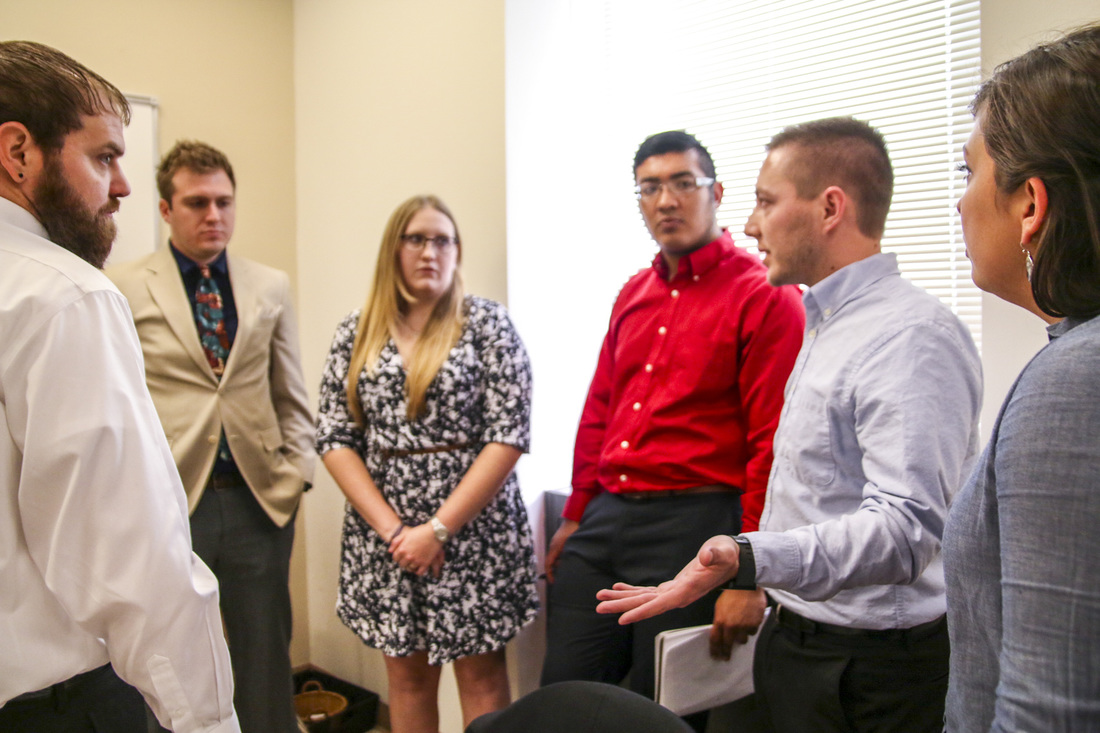 … followed by feisty negotiations about alliances. Junior undergraduate Cameron Conyers (second from the right) and his team, representing Egypt, talk with representatives of the U.S. (center). Photo: Toni Klemm … followed by feisty negotiations about alliances. Junior undergraduate Cameron Conyers (second from the right) and his team, representing Egypt, talk with representatives of the U.S. (center). Photo: Toni Klemm Back to the real world of policy-making, the class finished with a review of the conference in Paris by two of the instructors. Dr. Berrien Moore, Professor in Meteorology and also Dean of the College of Atmospheric and Geographic Sciences at OU, gave a summary of the progress. Dr. McPherson joined via Skype live from the Conference of the Parties (COP21) negotiations to give a feel for the vibe at the meeting, which was overshadowed by the terrorist attacks that had France still in shock. “Any time that a delegate from a different nation came up and spoke, they always prefaced it by some comment [about the terror attacks], like their heartfelt feelings for the people of Paris and the nation of France,” McPherson remembers. In her opinion, the Paris attacks played an important role in the success of the conference. “There was almost a sense that a lot of the nations wanted Paris to have an opportunity to, you know, rise on the pedestal.” 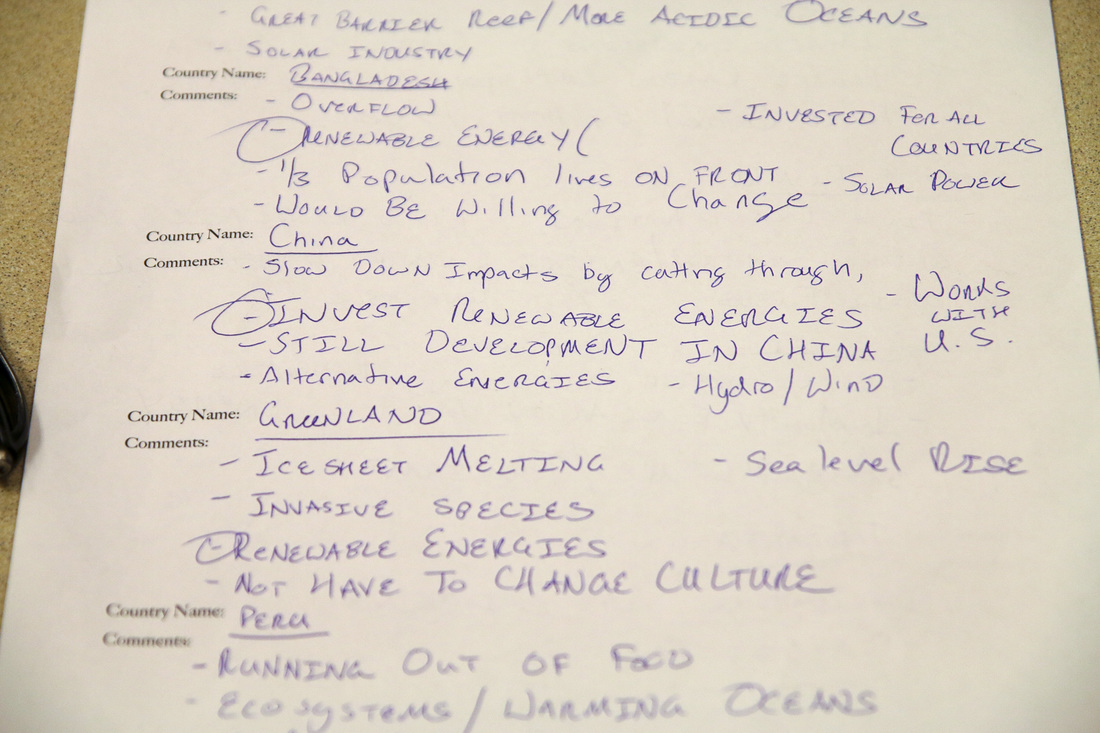 (c) Toni Klemm (c) Toni Klemm “Managing for a Changing Climate” will be offered again as a Massive Open Online Course (MOOC) this coming fall semester at the University of Oklahoma. To receive college credit, students need to be enrolled as OU students, but anyone with internet access who is interested can participate for free (though without getting credit). Follow janux.ou.edu and the South Central Climate Science Center on Facebook and Twitter for updates. The class instructors presented this course at the 2016 annual meeting of the American Meteorological Society. Download their poster here.
The course was made possibly by the generosity and collaborative spirit of the OU College of Atmospheric and Geographic Sciences, the Oklahoma Space Grant Consortium (supported by NASA), and the South Central Climate Science Center (supported by the USGS). 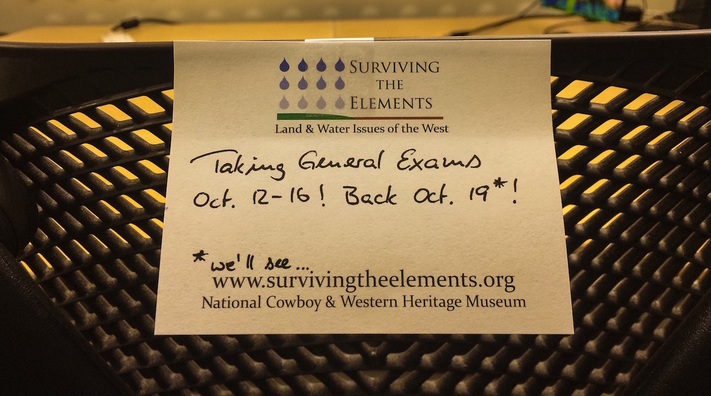 (c) Toni Klemm (c) Toni Klemm This post was originally written for the Early Career Climate Forum and posted in November 2015. Three weeks ago I passed my general exams (aka comprehensive exams or preliminary exams). It’s something Ph.D. students must go through before advancing to becoming a Ph.D. candidate. It's a test of their knowledge, but passing requires more than just knowing stuff. In my department at The University of Oklahoma, general exams are the transition point from classwork to doing research. The exam committee tests whether the candidate knows the state of the science in all areas related to their research, and it’s for the student to prove they are ready to conduct independent research. Like most generals, mine were divided into a written and an oral portion, although the particulars can vary depending on committee, discipline, and university. My generals consisted of five essay exams on five consecutive days. Each day, I had to answer three to six questions from each of my five committee members within 8 to 12 hours, followed by one, 2-hour session of follow-up Q&A and discussion with all of my committee members at once. 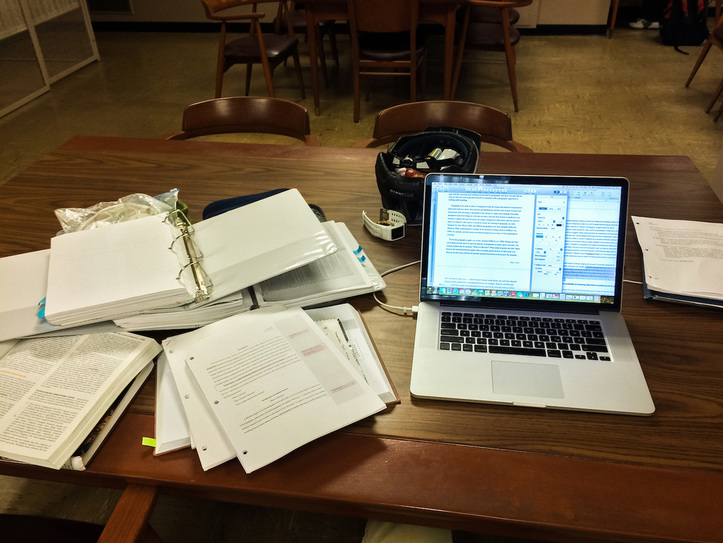 (c) Toni Klemm (c) Toni Klemm The key to making it through the generals is planning, persistence, and strong nerves – and a chunk of good luck. About 6 months ago, in early May, I presented my preliminary research idea to my committee and met with each member to sketch out topics to study for, things they thought would be good for me to know given my research focus. This gave me focus areas and goals to study for, which otherwise would have been hard given that my dissertation spans the fields of social sciences, meteorology, and agriculture. So, how did it go? The short answer is, it was a nightmare and mental torture beyond anything I had ever experienced before. But I passed, so I probably shouldn’t complain too much. But the task I faced each day of the exam was massive, and 8 (or 12) hours were over before I knew it. So good organization was key. Thankfully, my exam was “open book” (as opposed to closed book), so I could use all my handwritten notes from six months of studying along with other sources. However, handwritten notes were probably not the smartest choice, since text files are more easily searchable for keywords and topics. Luckily though, I use referencing software like EndNote, BibTex, or ProCite, to manage hundreds of journal papers, reports, book chapters, websites, and personal communication; each with entries containing abstracts, notes, cross-references, URLs, and of course the publication as a PDF file, catalogued in virtual folders and tagged with meaningful keywords. For a question about climate predictability or forecast skill assessments I had a folder of references. For a question on the economic value of seasonal climate forecasts, I had a folder for that too. 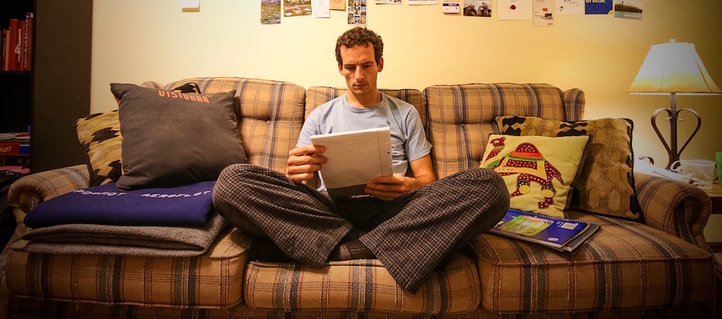 (c) Toni Klemm (c) Toni Klemm The written portion of my exam was a rollercoaster ride of joy and despair. I felt confident giving a good answer and even enjoyed some of the questions. But I was under massive time constrains, and at the end of every day, my brain was exhausted from the brutal workout and capable of handling no more than making dinner and preparing lunch for the next day. I might have looked calm, but inside I was under immense stress. But then I should be.
Generals are to test what you’re capable of. You’re a rookie in a boxing match taking on five professionals at the same time. Your goal shouldn’t be to win or to impress anyone, but to not get knocked out. Knowing that, I’m sure no one on my committee expected me to ace the generals, and realizing that helped me keep my expectations realistic and stay positive. By the way, I tried to not see my committee as this group of people set out to give me an unnecessary hard time, but as a team of experts giving their time helping me to succeed with my research idea, advancing science – and, oh, maybe getting a job later on. If, somehow, the written part of the exams doesn’t stress you out enough, the oral part sure will. My committee was given one week to go over my written answers before the oral test. This meant I too, had one week to go over my five essays, to find weak spots, parts I explained poorly or was too vague on, or didn’t reference well. All of this was to try and anticipate what my committee would hone in on with more detailed questions. I identified plenty of weak spots, and quickly realized that whatever I did, I still had huge knowledge gaps, despite the five months of studying before the exams. From plant physiology and climate predictability factors, to map projections and the role of place in communicating and mediating information, to comparing single climate models and model ensembles. It’s easy to send someone out on thin ice with just one discipline, let alone multiple. I’m usually comfortable with public speaking, but during the oral exam I was so nervous that I could barely phrase a full sentence, or even remember the question. To my advantage, all questions were follow-ups from my written exam, so at least I didn’t fall over any new tripwires. Still, I was struggling not to stress out. After some 90 minutes of mental drudgery, I was asked to wait outside for my committee to discuss the final result. A colleague had warned me that no matter how much I know, there will come a point at which I won’t know the answers anymore; admitting this isn’t failure, but more or less part of the process. Still, as I sat there waiting I felt awful, and I honestly didn’t expect them to let me pass. It was impossible to gauge whether my answers had been good enough. I reflected - in a search for words (and self-confidence) I had asked each committee member to repeat almost every question. Most of my answers had been stammered syllables, not sentences. While I waited outside I mentally prepared (or hoped?) for a final question that I could answer really well. Seven or eight minutes later –– sooner than I expected –– the door opened I was asked back in. I expected a long explanation for their decision, followed by a final, deciding question, and the verdict. Something else happened. Before I fully scanned the room, my advisor stretched her arm out and congratulated me. The rest of my committee applauded! I was so baffled I actually asked her if this meant I passed. It did. I did great, she told me. No one ever thinks their orals go well. It took me a few days to appreciate and fully realize what had just happened. There was no sudden relief, exhaling, falling back into an armchair and enjoying the rest of the week. I had to finalize my research proposal, continue developing a survey, and start preparing for upcoming conferences. One job done, on to the next one – I feel like this will be the new normal from now on. But I successfully completed a huge career hurdle and that sure is something. 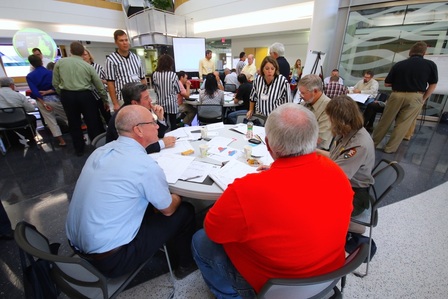 (c) Toni Klemm (c) Toni Klemm This post was originally written for the Early Career Climate Forum and posted in September 2015.
Before doctoral students can embark on their research journey they have to pass a general exam, a one-week torture chamber to prove they know all about the methods and fields of science they will touch upon in their upcoming research. My research at the South Central Climate Science Center covers agriculture, climate modeling, statistics, GIS, and social science, so there’s lots to learn, and some of these fields don’t overlap a lot in their methods or language, to say the least. I’m developing tailored seasonal climate forecasts for agricultural producers in Oklahoma. Interdisciplinary research can be messy, stressful, confusing, and very time-consuming—maybe one reason why it is not for everyone. I find it fascinating, though, for exactly these reasons. Conducting, facilitating and funding interdisciplinary research with scientists and stakeholders is one of the main purposes of the Climate Science Centers. One challenge with applied, interdisciplinary problems is actually solving them, providing solutions that people are happy with. Solving these sorts of problems involves getting diverse stakeholders to sit together at a table and understand each other’s perspectives, work together, learn from each other, and come out with practical solutions. This isn’t easy, as witnessed by the challenges involved in matching stakeholders’ needs with the sorts of products and insight researchers can provide, like the seasonal climate forecasts issued by the Climate Prediction Center (CPC). Many farmers and ranchers say these forecasts are unreliable, difficult to read, and don’t give them the information they need to make important decisions. They were developed in what some researchers call the “loading-dock approach”: putting information out on the loading dock, walking back inside, and waiting for people to pick it up and use it. How do we improve on the loading-dock approach? One alternative is what social scientists call adaptive co-management, a combination of two techniques many people are already familiar with: co-management and adaptive management. Co-management describes the collaboration of different stakeholders whereas adaptive management describes flexible, adaptable procedures that incorporate feedback and can change over time through so-called dual-loop learning—basically learning by doing. Adaptive co-management, then, is decision-making among multiple stakeholders with trust, respect, and equal influence who acknowledge that any one result or solution is not the be-all and end-all to the problem but may need to change over time. Changes in farm management, new regulations, shifts in commodity prices, or advances in climate research (such as higher resolution climate models) can force all decision-makers to adapt to new conditions. Sounds like a great idea, doesn’t it? Unfortunately, various obstacles can prevent stakeholders from developing solutions, even when they use adaptive co-management strategies. Common stumbling blocks include preconceived attitudes about other stakeholders (often a result of unresolved conflicts from the past), unwillingness to share influence and power, inability to commit financial or human capital, or simply not understanding each others’ culture and language, literally and figuratively. This last one is a problem that often occurs when “western” scientists work with local experts in developing countries. Institutional mechanisms like meetings, translation, collaboration, and mediation can help develop solutions and products that all participants will eventually use, though none of these is a panacea. Despite these obstacles, adaptive co-management strategies are already being successfully applied. The collaboration between the South Central Climate Science Center and the Great Plains Landscape Conservation Cooperative in restoring native grasslands, which Jessica wrote about last week, is one good example. So are NOAA’s Regional Integrated Sciences and Assessment (RISA) teams, such as GLISA around the Great Lakes, SCIPP in the south-central US, or CLIMAS in Arizona, New Mexico, and northwestern Mexico. While the Climate Science Centers are more involved in climate science integration into adaptation and protection of natural and cultural resources, RISA teams work with a range of sectors, including public health, on climate risk management. The USDA Regional Climate Hubs help farmers, ranchers, and forest owners to adapt to climate variability and change. Internationally, the International Research Institute for Climate and Society (IRI), based at New York’s Columbia University, works with stakeholders in developing countries on strategies to transfer climate science into risk assessment and mitigation. Related material: Cash et al. (2006): Countering the Loading-Dock Approach to Linking Science and Decision Making: Comparative Analysis of El Niño/Southern Oscillation (ENSO) Forecasting Systems. Science, Technology & Human Values 31, p. 465-494. Plummer & Armitage (2007): Charting the New Territory of Adaptive Co-management: A Delphi Study. Ecology and Society 12, article 10. 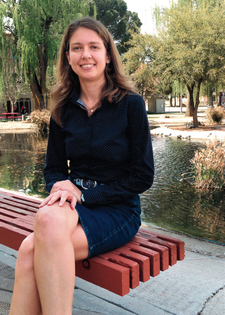 (c) Jocelyn Apodaca, NMSU Press (c) Jocelyn Apodaca, NMSU Press This post was originally written for the Early Career Climate Forum and posted in August 2015.
Wildlife habitats and wildlife migration are big issues when it comes to effects of climate change. While the planet continues to warm - 2014 was the warmest year on record according to NOAA – warm seasons become longer and cold seasons become shorter in many parts of the US. This allows some species to expand their geographic ranges while other species may experience unsuitable climatic conditions or have to cope with new predators and competitors for food. New research at New Mexico State University (NMSU) highlights how climate change affects ecosystems and species migration in the region, information that can be used to inform decision-making on the state level. Virginia Seamster finished her Ph.D. in Environmental Sciences in 2010 at the University of Virginia. During her post-doc at NMSU she was part of a team of 6 researchers studying 20 terrestrial vertebrate species, which include mammals, birds, reptiles, and amphibians, in Texas, New Mexico, and Oklahoma. "Average annual temperatures are projected to increase across New Mexico and the rest of the south central region that we're focusing on for this project," Seamster says. The team used climate projections for the years 2050 and 2070 from models that were also used in the latest IPCC report. These projections were used as inputs for so-called species niche models, which can estimate a species’ range based on known occurrences of the species. In a reverse engineering kind of approach this allows the researchers to estimate how the distribution of suitable climatic conditions for certain species may change as the regional climate changes. Virginia Seamster’s post-doc research was funded by the South Central Climate Science Center. The center is one of eight climate science centers (CSC) in the US and conducts applied research in the south-central US with the goal of supporting climate-related decision making in the region. The CSCs conduct a lot of outreach and education in their respective regions, but also fund and conduct scientific research. "This type of project could influence future revisions to New Mexico's State Wildlife Action Plan and work being done by wildlife managers in the state, including biologists at the New Mexico Department of Game and Fish,” Seamster explains. "The study is designed to provide information to land managers and decision makers to assist in their respective efforts," says Ken Boykin, ecologist at NMSU and lead investigator of the project. Virginia Seamster has recently transitioned from her wildlife-related post-doc position to a job at the New Mexico Department of Game and Fish. There she is involved with reviewing and helping to select research and other projects focused on non-game wildlife that the department funds annually through its Share with Wildlife Program. She also helps to maintain the Biota Information System of New Mexico, which provides information on the biology and ecology of thousands of species found in New Mexico. Finally, the Ecological and Environmental Planning Division that Seamster is now a part of is leading the process for revising New Mexico’s State Wildlife Action Plan. Publications about this research are forthcoming. Wildlife habitats and wildlife migration are big issues when it comes to effects of climate change. While the planet continues to warm - 2014 was the warmest year on record according to NOAA – warm seasons become longer and cold seasons become shorter in many parts of the US. This allows some species to expand their geographic ranges while other species may experience unsuitable climatic conditions or have to cope with new predators and competitors for food.
Virginia Seamster finished her Ph.D. in Environmental Sciences in 2010 at the University of Virginia. During her post-doc at New Mexico State University she was part of a team of 6 researchers studying 20 terrestrial vertebrate species, which include mammals, birds, reptiles, and amphibians, in Texas, New Mexico, and Oklahoma. "Average annual temperatures are projected to increase across New Mexico and the rest of the south central region that we're focusing on for this project," Seamster says. The team used climate projections for the years 2050 and 2070 from models that were also used in the latest IPCC report. These projections were used as inputs for so-called species niche models, which can estimate a species’ range based on known occurrences of the species. In a reverse engineering kind of approach this allows the researchers to estimate how the distribution of suitable climatic conditions for certain species may change as the regional climate changes. Virginia Seamster’s post-doc research was funded by the South Central Climate Science Center. The center is one of eight climate science centers in the US and conducts applied research in the south-central US with the goal of supporting climate-related decision making in the region. "This type of project could influence future revisions to New Mexico's State Wildlife Action Plan and work being done by wildlife managers in the state, including biologists at the New Mexico Department of Game and Fish,” Seamster explains. "The study is designed to provide information to land managers and decision makers to assist in their respective efforts," says Ken Boykin, ecologist at NMSU and lead investigator of the project. Virginia Seamster has recently transitioned from her wildlife-related post-doc position to a job at the New Mexico Department of Game and Fish. There she is involved with reviewing and helping to select research and other projects focused on non-game wildlife that the department funds annually though its Share with Wildlife Program. She also helps to maintain the Biota Information System of New Mexico, which provides information on the biology and ecology of thousands of species found in New Mexico. Finally, the Ecological and Environmental Planning Division that Seamster is now a part of is leading the process for revising New Mexico’s State Wildlife Action Plan. This post was originally written for the Early Career Climate Forum and posted in June 2015.
The Early Career Climate Forum (ECCF) was started about two and a half years ago, in December 2012. After a small group of students and post-docs attended a great early career training hosted by the Northwest Climate Science Center.The ECCF was a means to stay connected, to expand our network, and to share research ideas and experiences in graduate school or in our professional careers. Soon we learned that there was an actual need for an online forum like ECCF and won support from USGS and the Climate Science Center (CSC) network. With all the support came no shortage of pressure to succeed, though. It seemed everyone was waiting for our great vision to become reality. We had plenty of ideas, but no clue what to start with. So we asked our readers, followers, and subscribers: “What do you want?” and “Who are you, anyway?” We conducted a survey to find out what they wanted to see on the ECCF. The answers included just about everything, from advertising job openings and upcoming conferences, to hosting webinars and actual workshops. We ranked the survey responses based on consensus among survey responders and what we thought we could realistically achieve. The new ECCF website, the discussion forum, and listserv reflect this ongoing process. We are now one of eight priorities identified by the National Education and Training Work Group for the CSCs. In January 2015, we received funding to support the development of the revamped ECCF website, manage content and additional initiatives, and in May 2015 we teamed up with the Northwest Knowledge Network who hosts our new website. Most of us found the ECCF because we knew someone who knew someone. We learned to build an organization, coordinate efforts, set agendas, and determine priorities. Building a platform like ECCF from scratch was a lot of fun and a tremendous learning experience for all of us. It’s been a lot of work, and we are looking forward to many more discussions and projects. Are you interested in getting involved with ECCF? If you want to become part of the Early Career Climate Forum, please email us at [email protected] and tell us about your background, what you do, where you work, and the ways you would like to contribute to ECCF. We look forward to hearing from you! Follow us on Twitter and Facebook.  (c) Toni Klemm (c) Toni Klemm This post was originally written for the Early Career Climate Forum and posted in November 2014.
AGU comes in December, AMS in January, AAG in April – the next big conference is always around the corner – and so might your poster presentation. Here are a few tips for a killer poster that will rock the place. Figure this. Your poster is not a whole journal article printed on a large piece of paper. Avoid large pieces of text and use figures, tables, charts, diagrams, and captions – sort of a journal article but without the text. Use these visuals as aids when you’re explaining your research to someone. Also, check that colors go well together (pie charts, flow charts, bar graphs, illustrations, schema). They might look good on screen, but may be hard to read on print. Less is more. Don’t try to fit every aspect of your research onto the poster. Don’t state every little detail of you research, but focus on the main stuff, one major finding. Keep text short, maybe as bullet-pointed lists. Give people insights into your research hooks to ask follow-up questions. Proportions. Make sure your poster size meets the conference requirements and is not bigger than your allowed space. Test that your figures etc. look good from four or five feet away, that they’re not too small and not too big. Make a test print if necessary. Normal text should be in font sizes between 36 to 44 points, titles about twice that. Fonts. Don’t give your poster fancy fonts to stand out. It’s about the content, not (just) the looks. The rule of thumb is 2 to 3 different fonts, not more. Pick a serif font (e.g., Cambria, Georgia, Garamond, Times) for normal text and a sans-serif font (Arial, Helvetica, Impact, Gill Sans, Futura) for poster title, axes titles, captions etc. Serif fonts are better for flow text because their small “feet” form an imaginary line, making it easier for your eyes to follow the line of text. Sans serifs (sans is French for “without”) meanwhile are best for titles, subtitles, captions, and other shorter pieces of text. Bring business cards. This is a no-brainer, right? People might want to stay in contact with you, so business cards are a must-have. Also, sometimes posters can be left hanging after the poster sessions ended (and without you there). For those cases bring a little pouch (seek your inner Bastelkönig to make one) for your business cards and pin them next to your poster. Alternatively, put your contact info on the poster, or create a QR code with your contact details. QR codes are free to make online (links below), and there are plenty of free reader apps for smartphones. Say something. “What are you working on?” “What’s your research about?” If you hear this, your poster caught someone’s attention. Well done! Now you need a short yet compelling elevator speech. Give yourself 30 seconds to tell the beef of your research, but tell it in a way an 8-year-old child would understand it. Keep it simple and free of jargon or weird acronyms. Advanced level: Ask the person about his or her background and tailor your speech on the fly. A marine biologist might need a different explanation than a volcanologist. Electronic posters. It’s not very common, but every so often poster sessions use electronic posters (they’ll tell you ahead of times). This means you’ll have a big-screen TV to present on. This might sound odd but it’s actually great news for you. Use the screen to present a short (2 to 3 minutes) powerpoint presentation instead of just showing a static “poster”. Find out about the screen size, which ratio (4:3, 16:10, 16:9) and resolution (full-HD, HD) and format your slides accordingly to use the space in the best way possible. Bring monitor cable adapters and save your presentation in PDF format or the slides as JPEG files (Powerpoint and Keynote both let you do this), in case you have to use a computer provided by the conference host. Don’t assume your powerpoint slides will look the same on another computer. More advice on poster design: http://betterposters.blogspot.com (weekly critique of a sample poster) Colin Purrington: Designing Conference Posters Discussions on Poster’s Graphic Design Elements QR Codes  (c) Toni Klemm (c) Toni Klemm This post was originally written for the Early Career Climate Forum and posted in September 2014.
The policy arena is not a place many scientists are familiar with and even fewer are trained to work in. To help scientists learn how the political process works, the American Meteorological Society (AMS) runs the AMS Policy Program. It is divided into the Summer Policy Colloquium, a ten-day workshop every summer in Washington, D.C., and the Congressional Science Fellowship Program, a one-year paid appointment to work as science advisor for a member of congress, also in Washington. The application deadline for both programs approaching fast, so we talked to Dr. Bill Hooke about the Summer Policy Colloquium and the Science Fellowship Program. He is an atmospheric scientist, author, avid blogger, current associate executive director of the AMS, and he directed the AMS Policy Program from 2000 to 2013. Who should apply for the Summer Policy Colloquium? Not everyone should apply. But if you’re planning on being a leader, a department chair, a dean, or a business manager, you will quickly realize how important it is to understand how national policy works and affects your company, your university, or your agency. What can people take away from the colloquium? One thing they can learn is how the federal budget for science works. Where does the research money for a university come from? Why do some departments get more than others? How do you increase those budgets? What poses risks to those budgets? Every scientist should know the answers to these questions, but very few actually do. Also, it is an affirming experience. It happens that scientists who are interested in the political process sometimes feel that their universities don’t appreciate them. When they come to the colloquium and meet other scientists with similar interests, it is affirming. It verifies that leadership in science is a reasonable career and aspirational goal. What do applicants need to bring to the table? We look for people with an interest or background in policy-making, or worked in journalism or blogging, anything that dealt with politics or societal impacts, something a little broader than just their science itself. But you also have to be a good scientist. If you’re not a good scientist, you’re not going to be a good leader of scientists. But on the other hand, just being a good scientist doesn’t make you a good leader of scientists, too. You have to be a little broader than your science itself to be respected among the policy-makers in your own university or company. Is the Science Fellowship Program the next step up from the Summer Policy Colloquium? The colloquium is like a 10-day policy boot camp. The Science Fellowship Program is more of a time commitment. It’s like having a Post-Doc. You get an in-depth understanding of the policy process as a participant of the process rather than a spectator. Is the Summer Policy Colloquium a necessary first step for the Science Fellowship Program? No, it is not a necessary first step. We’ve had people do the Science Fellowship Program who haven’t done the Summer Policy Colloquium. Neither is the colloquium a necessary step to take on a leadership position. There are many more leadership programs out there. Are jobs in politics the main reason why people do the Science Fellowship Program? Of the people who become congressional science fellows, about a third of them stay on Capitol Hill, a third stay in Washington in jobs related to politics, and a third return to the university environment. So, only about two third of all participants actually stay in politics-related jobs in D.C. To learn more about or to apply for the AMS Summer Policy Colloquium or the AMS Congressional Science Fellowship Program, visit http://www2.ametsoc.org/ams/index.cfm/policy/summer-policy-colloquium/ and http://www2.ametsoc.org/ams/index.cfm/policy/congressional-science-fellowship/. This year's Policy Colloquium will take place from May 31 to June 9, 2015. Applications will open soon. The Science Fellowship Program will start on September 1, 2015. Applications for this close on March 15, 2015. This post was originally written for the Early Career Climate Forum and posted in March 2014.
This Sunday, Years of Living Dangerously will premiere on the cable network Showtime. Cinematic stars like James Cameron (director, Titanic, Avatar), Jerry Weintraub (producer, Ocean’s 11/12/13) and Arnold Schwarzenegger (actor, Terminator 1/2/3) take on the challenge of raising public awareness about the causes and impacts of climate change and global warming. The Plot From wildfires in California and illegal logging for palm oil plantations in Indonesia to the Syrian civil war — Pulitzer Prize winning journalists like Tom Friedman and Hollywood stars like Harrison Ford, Matt Damon, Jessica Alba, and Don Cheadle play the main characters in this real-life drama about human-made climate change. They take the audience around the world to places where causes and impacts of rising temperatures, declining rainfall, receding glaciers, and shifting ecosystems become visible. “This is exciting television”, says co-producer Joel Bach (60 Minutes), ”featuring some of the biggest stars on the planet doing something they've never done before.” But it’s not just bold pictures and big drama. To explain what is going on behind the scenes, the “correspondents” (this is what Ford & Co. are called in the series) meet renowned climate scientists like Katharine Hayhoe, Michael E. Mann, and James Hansen or forest entomologist like Diane Six, talk to government officials, interview people in Syria where drought and famine pushed a volatile political situation over the edge into civil war, join activists in Indonesia and Bangladesh, and speak with jobless factory workers in Plainview, Texas, who are leaving the town in masses because of a three-year agricultural drought that led to the closing of a giant meatpacking plant, laying off more than 2,000 people at once. Actors, activists, and scientists walk the audience through each episode, revealing piece by piece this complex interconnection of climate, ecosystems and society, getting viewers thinking what he or she can do to act. How are everyday shopping decisions connected to illegal logging in Indonesia? How are forest fires in California leading to bark beetles migrating from the US far into Canada, devastating entire landscapes? Narrated by the actors themselves, the viewer learns about the science, while breathtaking images of pale-grey Montana forests and lake-covered polar ice masses go along with close-up, news-like interviews with people in civil-war-beaten Syria. Telling Stories, reaching people “This is 100 percent a people’s story” says co-producer James Cameron. Years of Living Dangerously is not a documentary about climate change, it’s a documentary about people who do something about climate change, co-producer David Gelber (producer, 60 Minutes) points out. Because “these personal stories of people today will become everyone’s stories in the coming decades.” The series does not try to move the “die hard” skeptics, but hopes to get those thinking and moving who are “sort of in the middle” called the concerned, the cautious, the disengaged, and the doubtful, according to the Six Americas study done by the Yale Project on Climate Change Communication, which the producers used to study their target audience. The series will interview both democrats and republicans, climate action supporters as well as deniers. “We do not want to be perceived as the liberal-democratic drum beater.” Showcasing celebrities like Ian Somerholder (“The Vampire Diaries”, “Lost”) the series hopes to reach people at both ends of the political spectrum who otherwise wouldn’t be interested in climate issues. More than TV Much like Al Gore’s An Inconvenient Truth (2006) had its online counterpart www.climatecrisis.net, “Years of Living Dangerously” will not happen solely on TV, says Heidi Cullen of Climate Central, one of the series’ science advisors. Called the Years Project, series and website will highlight environmental movements and organizations like Conservation International which is active in Indonesia, or the Climate Corps, a graduate student program of the Environmental Defense Fund to help businesses, cities and universities reduce their carbon footprint while also reducing costs. As part of the series, the producers announced an action campaign to raise the level of public engagement. In collaboration with Vulcan, a Seattle-based company owned by Microsoft co-founder Paul Allen, the series wants to reach out to public leaders, from journalists through religious leaders and teachers to the public and private sector “to try and get people engaged and take a position on climate change”. First successes seem already to be coming. In Indonesia, the producers claim, their investigations have already proven successful. “Shining a light on things that people may not have known before is one direct way that we are trying to make a difference.” More ways to will be published on the program’s website. Years of Living Dangerously is certainly the boldest step so far towards raising a much needed public awareness for the eminent risks of climate change. The coming eight weeks and the months and years after that will show if the Years Project can accomplish what many have failed to achieve before.  (c) Katharine Hayhoe (c) Katharine Hayhoe This post was originally written for the Early Career Climate Forum and posted in March 2014.
Years of Living Dangerously, a big-budget, 9-episode Showtime TV documentary by Showtime, tries to communicate the seriousness of climate change through personal stories and first-hand experiences of people across the globe. To make sure they get the science right, the producers collaborate with a panel of distinguished experts. We interviewed one of them: Dr. Katherine Hayhoe from Texas Tech University in Lubbock, Texas. Dr. Hayhoe is an atmospheric scientist and professor at Texas Tech with over 100 peer-reviewed publications. While having served as a reviewer for the 2007 IPCC report and lead author for the 2013 US National Climate Assessment, Dr. Hayhoe is a book author and renowned public speaker on topics of climate change. Her work as climate evangelist has been featured in the PBS documentary series “The Secret Life of Scientists and Engineers“. Why is it so difficult to communicate the seriousness of climate change and the scientific consensus to people outside of science? What are your experiences? Many of us believe that climate change threatens things we hold dear: our personal liberties, our ideology, our job security, and even our faith. When we are that worried and even afraid of losing something so important to us, trying to convince us just using facts is fruitless. The information will just go in one ear and out the other. This problem is compounded by the fact that, until just recently, most people living in the United States (except for those in Alaska!) were not seeing any actual impacts of climate change with their own eyes. So the problem has been perceived as a distant, far-off threat, while the solutions are perceived as an imminent, real-time threat. That’s a tough hurdle to overcome. How do you deal with climate skeptics? With people who have genuine questions and concerns, it’s important to spend time understanding where they are coming from and what they are concerned about. These concerns are real, and they’re important. By demonstrating how climate change — and climate solutions — are not incompatible with conservative, or faith-based, values we can often overcome many of the objections to the reality of the problem. On the other hand, about 15% of the U.S. falls into “category #6” of the Six Americas of Global Warming, a category called “Dismissive". For many of the people in this category, there is really no way to talk to them that would ever make a difference. Even if God (or Rush Limbaugh?) appeared right in front of them with flaming tablets of stone saying “Climate Change is Real and Dangerous” that wouldn’t change their minds. As scientists, we often fall into the trap of focusing on people in the Dismissive category because they are the most obviously and often the most vocally opposed to what we have to say. However, we have to remember that they represent only a small segment of the population and — most likely — one that we cannot hope to change. Years of Living Dangerously is not so much about climate change as about storytelling, about people who are affected by and people who do something about climate change. Producer Joel Bach said this personal component makes for a far more compelling story than just "something about climate change”. Do you think there is a message in here for climate scientists who want to engage with the public? Yes, I think there definitely is. Why do we care about climate change? Let’s be honest: the Earth will survive. We care about it because of people and the environment in which we live. Our society is built on the assumption that climate is relatively stable. We build our cities within a few feet of sea level; we have entire neighborhoods with almost no air conditioning because it didn’t used to get hot enough to need it; we have all kinds of infrastructure that assumes a given risk of flood, freeze, drought, or heat. Today, that assumption is no longer valid. And because climate is no longer stationary, that means our infrastructure and human society in general is no longer perfectly adapted to its local environment. The more climate changes, the worse the problem becomes. And this problem is already affecting real people in the places where we live today. It’s no longer about the polar bear - it’s about us. One way for scientists to learn to communicate and perhaps to use a more figurative language can be to read fiction literature. Another way might be to take a course in English or in communication. What is your personal secret recipe to make sure people “get" your message? What were your biggest helpers in becoming a more successful public speaker and writer? There are many different ways for us to improve our communication skills. I was fortunate enough to be able to attend several media training workshops early in my career that helped me to distill my information down into manageable, digestible messages. A lot of it was also trial and error: asking people whose opinions I valued to give me their honest opinion of my slides, my presentation, and my messages. (Have to leave the ego at the door for that one!) A third important step was to spend a lot of time understanding who I was talking to. Our communication can only be effective if it meets existing needs; and how will we know what those needs are unless we spend time talking to people about them? And the fourth is just to get out and do it. There’s nothing like feeling as if your presentation was a complete flop to motivate you to get it together for the next time! Related Material Years of Living Dangerously Website (http://yearsoflivingdangerously.com/) Years of Living Dangerously - Episode 1 (https://www.youtube.com/watch?v=brvhCnYvxQQ) Global Warming’s Six Americas (Yale Project on Climate Change Communication, 2012) (http://environment.yale.edu/climate-communication/article/Six-Americas-March-2012) Cultural Theory and Individual Perceptions of Environmental Risks (Linda Steg & Inge Sievers, 2000) (http://eab.sagepub.com/content/32/2/250.short) Cool dudes: The denial of climate change among conservative white males in the United States (Aaron McCright & Riley Dunlap, 2011) (http://www.sciencedirect.com/science/article/pii/S095937801100104X) New York Times article on “Cool Dudes” (2011) (http://www.nytimes.com/cwire/2011/10/05/05climatewire-why-conservative-white-males-are-more-likely-11613.html?pagewanted=all) 5 Tips on Communicating Climate Science (AGU, 2013) (http://www.youtube.com/watch?v=pT0iTmTTpF4) The Debunking Handbook (John Cook & Stephan Lewandowsky, (2012) (http://www.skepticalscience.com/docs/Debunking_Handbook.pdf) The Scientific Guide to Global Warming Skepticism (John Cook, 2010) (www.skepticalscience.com/docs/Guide_to_Skepticism.pdf) This post was originally written for the Early Career Climate Forum and posted in November 2013.
Global temperature increases have been stalled since 2000. Meanwhile, the extreme summer droughts of 2011 and 2012 left many US farmers in ruins. Most climate models failed to project these phenomena correctly. US researchers now took a new attempt on finding a solution. The hiatus in global warming since the year 2000 gives climate skeptics and climate deniers tail wind for making the case against human-caused global warming. At the same time, the extreme summer droughts of 2011 and 2012 left many US farmers in ruins. The US Department of Agriculture (USDA) estimates, more than 40 % of all US farms and almost 60 % of all US crop land were affected by severe or extreme drought, causing a record-breaking $17.3 billion in crop losses, according to the Federal Crop Insurance Program (FCIP). Most climate models failed to predict this hiatus in global temperature rise that occurred from 2000 to 2012, despite increasing CO2 levels. Instead of a flat temperature curve, models projected an unaltered increase. Scientists from Scripps Institution of Oceanography in San Diego, CA, now present a new attempt to model this recent hiatus – with success. Yu Kosaka and Shang-Ping Xie used the Geophysical Fluid Dynamics Laboratory Climate Model 2.1 (GFDL CM2.1), but in addition to prescribing radiative forcing, they also used recorded instead of modeled sea surface temperatures from the eastern tropical Pacific. This resulted in a remarkably accurate projection of the past temperatures, especially after 2000. Their model “reproduces the annual-mean global temperature remarkably well with correlation coefficient r = 0.97 for 1970–2012. Their findings suggest the current hiatus is based on a “La Niña-like decadal cooling”, natural climate variability. Their model configuration also projected the current hiatus and a number of seasonal and regional anomalies, such as the recent prolonged drought across the US. Although similar conditions can occur again, the authors say, the long-term warming trend is “very likely” to continue. Their results are published online at nature.com (subscription required for full view). Edit (July 10, 2015): Researchers found the extra heat content has been stored in the oceans. Veronica Nieves, Josh Willis, and Bill Patzert, researchers at NASA’s Jet Propulsion Lab (JPL) found that most of the additional heat content is stored in depth between 100 and 300 meters (300 – 1,000 ft). Their results are published in yesterday’s issue of Science Magazine (subscription required for full text). Open Access summary: http://earthobservatory.nasa.gov/IOTD/view.php?id=86184&src=twitter-iotd This post was originally written for the Early Career Climate Forum and posted in July 2013.
This is a web forum created so people can engage in discussions on all things climate and to learn from each other. So while we’ve been promoted and supported by pretty much every one of the eight regional Climate Science Centers in the US, let’s put up a topic that we all should be concerned about: Communication. And Food. A couple months ago I came across a TED talk in which a middle-aged American man presented his idea of a physically healthy community. He lived in South L.A. and was complaining about obesity and the omnipresence of fast food, and promoted growing healthy food, like fruits and vegetables. Now, before you’re bored and click on the link in hope to find something more exciting (you will!), bear with me for a moment. I find it difficult to engage people in a discussion if the issue in question is one that everyone had heard a million times, in particular if it’s one we all have our shortcomings with, like health, education … or climate change. Maybe one way to engage people in an issue like this is (1) to talk about the solution rather than the problem, and (2) speak their language. The Solution is the solution Pointing fingers at the people in front of you might reduce your own level of frustration, but it’s not what your message should be about (and if they’re not in front of you but rather absent, you should avoid doing this even more). Instead, you might respectfully tell a story about someone else with the same issues and how they solved this problem (and you may make up a story). Finding the cause to a problem is important, but finding the solution to the problem is a more immediate goal. By the way, the story-telling part here is, I think, one reason why it can be valuable for scientists to get out of the ivory tower and see what is happening in the real world. Speak their language This can be tricky for scientists, but it’s worth it. A good start to do that is asking what people already know. This way you might have something to build upon. Then, avoid jargon or at least explain your scientific lingo (which will make you avoid it, I’m sure). Use simple words and metaphors, use gestures to form relationships and to describe things, avoid run-on sentences, and don’t be too serious about yourself and your work (jokes are welcome). Try this text editor (http://splasho.com/upgoer5/?i), inspired by XKCDs “Up Goer Five” comic (http://xkcd.com/1133/), to describe a random problem using only the thousand most common English words. It might be a little over the top, but it might give you a first impression, and it’s great fun. Getting a message across is not an easy thing, and these are only a few short thoughts on how it might be easier. But the next time you’re struggling to get your message across, this might help you. Making an impact requires two parts. You need to understand the issue yourself (preferably better than your audience), and you need to give them at least a general idea of the issue. You might run across people who are somewhat fed up with climate change or healthy diets. It’s rare, but it can happen. So spice up your consumer advice to balance out the boredom of the actual topic. I know from my own experience, for scientists seeing their work from a less serious and more general standpoint can be tricky. But it is all so often essential. Now you may click on the video link above for a really cool example. Another point is to know what language to use, as this interview of Anthony Leiserowitz, the director of the Yale Project on Climate Change Communication, who is being interviewed by Bill Maher, shows. On one side you have the well-articulated diplomat (Leiserowitz), on the other side the big-mouth sledge hammer (Maher). Both are on the same side in terms of reducing carbon emissions to reduce global warming, and I’m not saying Leiserowitz is doing something wrong, but I bet the people watching the show like Maher more than Leiserowitz. So while Bill Maher would almost certainly get kicked out of any serious stake-holder meeting, he’d probably be loads more entertaining on your Saturday afternoon barbeque. The bottom line is this: it’s not just important that we as (future) scientists know what’s right or wrong. To be relevant, to actually make a change in the way we and all people do things, we have to know who we’re talking to. Because only then do we get the message across in a way people understand the facts and feel the need to act. A chat about ice cores and oil business
This post was originally written for the Early Career Climate Forum and posted in March 2013. A couple of evenings ago I had an interesting discussion with a friend of my roommate. Let’s call him Pete. Pete and I had never met before, so we started with the usual introduction, and continued with the usual “Oh, where are you from?” after he noticed my accent. This was succeeded by “And what do you do here?,” which is usually followed by “How did you end up in Oklahoma?” This time though, we didn’t make it to the last question. “So you do climate research?" he asked. "Do you believe in global warming?” I noticed a slightly provocative touch. I nodded my head and said “Sure. You don’t?” He shook his head: “Not in global warming, but in climate variability.” I was surprised. You don’t hear ‘climate variability’ all too often from people outside the field. I wasn’t sure yet what he was aiming at and asked for more. “Well, I don’t think it’s getting warmer overall. The climate’s always been changing, there were always warm and cold periods like now. How do you know it’s never been as warm as now?” Good point actually. Offhand I did my best to break down how tree ring analysis, pollen analysis and ice core sampling worked, but Pete remained unconvinced. “Do you really believe in these ice core things? I mean how do you know what those concentrations really mean?” This was going to be tough. The last time someone tested me about age dating was a professor three and a half years ago in an oral exam. “Scientists know about the effects of certain gases from today’s measurements. They might only be a hundred years long, but that’s enough to learn how ice core samples respond to changes in the atmosphere.” I wasn’t entirely sure about any of this. But it made sense to me, so I was hoping for the best. Thankfully he acknowledged my overwhelming, all-encompassing knowledge and shifted topics. Slightly. Some scientists, Pete said, were saying global warming isn’t real and the fuzz about greenhouse gases is just for scientists to get more funding and for the government to stress the oil companies. I had read these “findings”, too, but I didn’t expect people to believe this to a degree that they are actively defending it. But here I was, first time for everything. “So, assumed 10,000 scientists agree that the earth is warming and we’re the ones to blame, and 60 scientists (which is actually a realistic ratio[1]) argue they’re wrong. Why do you trust the 60 and not the 10,000?” – “I don’t know, but wouldn’t it be a perfect argument for working against the oil and gas industry?” I didn’t have any more facts to that, so I countered with a question of my own. “Why would a government, whose wealth is so much based on oil, want to get rid of a major profit supplier? That’s like cutting off the branch on which you sit.” Maybe he had just noticed the gap in his argumentation, or maybe my wisdom was still irritating him. He shifted topics again… Our discussion went on, with me mostly responding and him mostly changing directions every time his lines of argument reached a dead end. We touched on renewable energy and fuel-efficient cars, fracking and American oil independence, the great American military (that was his view), the great American economy (that, too), Greece, the sequester, football, red wine, chili, heartburn and smoking-caused cancer. And I noticed his arguments were getting weaker and less logical. After about an hour Pete had to leave, and I hoped I raised some suspicion within him that would eventually lead to a little more critical thinking. Don’t get me wrong, I’m not trying to be smarty-pants. I’ve been in Pete’s position a few times before, but instead of learning something I felt miserable and angry after being torn to pieces by some wisenheimer. Scientists shouldn’t be wisenheimers. If someone gives you a glimpse into his or her mindset we should greatly appreciate that, no matter how distorted it appears to us. Because it shows (1) that person wants to learn from you, and (2) sees in you a trustworthy person. And if you’re in climate research, isn’t that something to be thankful for? [1] Schulte, Klaus-Martin (2009): Scientific Consensus on Climate Change? In: Energy and Environment 19, p. 281-286. Abstract available at: http://multi-science.metapress.com/content/d588k23724201502/ [This blog post was originally written for the Early Career Climate Forum and posted in December 2012.]
How do you get 80 land managers, conservationists, tribal representatives and researchers from various backgrounds and most diverse areas to an agreement? Or should you? Well, let’s find out … The South Central Climate Science Center (SC-CSC), funded by the Department of the Interior in early 2012, deals with the diverse part of the south-central United States and Mexico, stretching from the coastal wetlands along the gulf coast of Texas, Louisiana and Mississippi to the agricultural lands of the Southern Great Plains to the deserts of New Mexico and northern Mexico. So when it came to nailing down research priorities for the upcoming USGS proposal solicitation in January 2013, the challenge was finding common ground amongst this – quite literally – wide range of research areas. For this reason, at the end of November the SC-CSC held a two-day climate science workshop in Fort Worth, Texas, to bring together those various areas of expertise. The 80 or so participants spanned not only research areas like economics, social sciences, meteorology and ecology but also state and federal land management and conservation organizations as well as representing two tribal nations in Oklahoma. These participants were organized into three major discussion groups, depending on their areas of interest: regional physical climate variability and trends, ecosystems and landscapes, and human dimensions. “We felt it was important to initially introduce people by discipline and identify common ground that way”, says Aparna Bamzai, Technical Coordinator at the SC-CSC main office at the University of Oklahoma (OU) in Norman, Oklahoma, and principle organizer of the event. Before the workshop, many of the participants may have known each other through research publications, but probably had not actually met each other. Dr. Paul Risser, an internationally renowned ecologist at OU, and Dr. Keith Owens, Professor and Head of the Department of Natural Resource Ecology and Management, moderated the “ecosystems and landscapes” breakout session on both days. The job of the two moderators, however, started long before the actual workshop, with many phone calls to be made and emails to be exchanged. “My role was to identify and recruit members for the session who would lead the discussion on specified topics”, Dr. Risser explains, “and to prepare introductory material for the session.” During the sessions, his job was to “keep the discussion on track and moving along at the right pace.” The goal, he points out, was to identify high-priority research studies. That also meant his diverse group had to develop a common language and methodology and find common ground in terms of temporal and spatial scales to work with. In a final wrap-up, the moderators presented the results from each of their sessions and discussed some of the steps forward for the near future. By December 20th, about three weeks after the workshop ended, a written summary of the group results will be submitted to the workshop participants for review. The finalized written summary will be available to the public in early 2013. So what’s next? The role of the SC-CSC, says Dr. Renee McPherson, Director of Research at the SC-CSC, is to provide a forum for scientists to promote and discuss their research. “Ideally,” Aparna Bamzai explains, “we would track collaborations initiated during the workshop and help these teams develop and submit proposals both to the DOI/CSC [Dept. of the Interior / Climate Science Center] initiative and external requests for proposals.” In the future, Ms. Bamzai adds, these so-called breakout sessions could be organized by research focus. Then, a session on drought could attract an inter-disciplinary audience. And this may result in both visible and invisible progress such as more interconnection between different fields of research and more interdisciplinary research proposals. “We feel”, Ms. Bamzai says, “that these types of proposals will be more successful and as a result draw more research dollars to the region.” “The goal is not research consensus”, Dr. McPherson sums up, “although that could be a possible result years from now continues.” “What we do encourage”, she continues, “is high-quality research, including projects that may illuminate differing opinions and methods.” * Toni Klemm is a German Ph.D. student in geography at the University of Oklahoma, and works at the South Central Science Center. At the climate science workshop in Fort Worth, which this article is about, he served as a note-taker in the “landscapes and ecosystems” discussion group. |
 RSS Feed
