|
Am 9. Juni und 6. September entscheiden wichtige Wahlen über die Richtung der Europäischen Union, der deutschen Länderpolitik und der Politik vieler Landkreise und Kommunen. Bei der EU-Wahl am Sonntag stehen 35 Parteien zur Wahl, von der rechtsextremen Alternative für Deutschland (AfD) bis zur linksextremen Marxistisch-Leninistischen Partei Deutschlands (MLPD), und alles dazwischen. Die Bundeszentrale für Politische Bildung hat eine Übersicht: www.bpb.de/themen/parteien/wer-steht-zur-wahl/europawahl-2024/. Und per Wahl-O-Mat kann jeder Wählende seine eigenen Prioritäten mit denen aller Parteien abgleichen und so etwas Licht in den Parteiendschungel bringen: www.wahl-o-mat. Links: Ein Lichtmast mit Wahlplakaten in Potsdam, südwestlich von Berlin. Rechts: Der Wahlzettel der EU-Wahl in Deutschland mit allen 35 Parteien. Jede:r Wähler:in kann nur eine Partei wählen. Um junge Wählerinnen und Wähler zur Wahl zu motivieren und ihnen aktuelle Themen und die Positionen der einzelnen Parteien näher zu bringen, organisierte der Parkclub Fürstenwalde, ein Treff für Jugendliche in der 25.000-Einwohner-Stadt südöstlich von Berlin eine Reihe von vier Podiums-Veranstaltungen. In der ersten Veranstaltung diskutierten und erläuterten Experten drängende Themen in der Region Ostbrandenburg, und in den folgenden drei Veranstaltungen erläuterten Vertreter der Parteien auf dem Stimmzettel für die EU-, Landes- oder Kommunalwahlen ihre Positionen und Prioritäten. Ich war als einer dieser Experten eingeladen, zusammen mit Professor Ralf Kohlen, ein Verkehrsforscher an der TH Wildau. Wir lieferten Explainer und Hintergründe zu Themen wie Digitalisierung, Biodiversität, oder auch dem Ausbau der Strom- und Verkehrsnetze. Der Klimawandel ist für die Landwirtschaft eine zentrale Herausforderung, das wurde schnell klar: Verlust der biologischen Vielfalt, Ertragsschwankungen und damit verbundene Einkommensunsicherheit, das immer weniger attrativ werdende Berufsfeld eines Landwirtes. Mögliche Lösungen Agrar-PV, Digitalisierung und Robotik sowie die Entwicklung neuer landwirtschaftlicher Produkte und kürzerer Wertschöpfungs- und Lieferketten. Die Idee war, die übliche Kombination von Wissenschaftlern und Politikern zu vermeiden, und zuerst Erklärungen zu aktuellen Themen zu liefern, bevor über die Positionen und Prioritäten der verschiedenen Parteien diskutiert und gestritten wird. Die Stimmung in unserer Sitzung war auf jeden Fall viel entspannter als in den folgenden Events.  YouTube YouTube Dieses Format - eine Podiumsdiskussion mit einem Live-Publikum, die auch per Livestream auf Youtube übertragen und dort für die Nachwelt festgehalten wurde - war für mich neu und trotz der entspannten Atmosphäre etwas nervenaufreibend. Letztendlich verlief die Veranstaltung aber reibungslos, auch dank der guten Vorbereitung meinerseits auf einige Leitfragen, die uns der Moderator im Vorfeld zugeschickt hatte. Ob es ein Erfolg war, lasse ich Sie entscheiden: www.youtube.com/live/8ngWuNH-xR4?si=RmlcYQ9dhxPe83Xx&t=56 Die drei Folgeveranstaltungen mit Politikern der zur Wahl stehenden Parteien: Europawahl: www.youtube.com/live/i7we5BvozMM?si=ylwW7WMLtSVBOFkM Kreistag Oder-Spree: www.youtube.com/live/0BvKCpyUe3U?si=1drHB3kvntWz3FkY Stadt Fürstenwalde/Spree: www.youtube.com/live/ooQtBfUGMEQ?si=hRHxxYf76w93xAUX On June 9 and September 6, important elections will determine the direction of the European Union, the federal states in Germany, and some local districts and cities for the next few years. A dizzying spectrum of 35 parties are on the ballot for the EU election next week, from the far-right Alternative for Germany (AfD) to the far-left Marxist-Leninist Party of Germany (MLPD), and everything in between. Read more here: www.bpb.de/themen/parteien/wer-steht-zur-wahl/europawahl-2024/ (in German). Left: A light pole with election posters in the city of Potsdam, southwest of Berlin. Right: The ballot in Germany for the EU election, which lists all 35 parties. Voters can only vote for one party. To get young voters interested in politics and to help them understand current topics in the regions as well as the positions of each party, the Parkclub, a youth club in Fürstenwalde, a town of about 25,000 people southeast of Berlin, organized a series of four events between late April and mid May. In the first event, experts discussed and explained (in German) some pressing topics in the region, and in the following three events representatives on the ballot for the EU, state, or local elections explained their positions and priorities. I was invited as one of those experts, to talk about challenges and current topics in agriculture in the region, all of which are driven more or less by climate change: biodiversity loss, agri-PV, digitalization and robotics, and the development of new agricultural products and shorter value and supply chains. Another expert, a professor from TH Wildau, a local university of applied science, talked about transportation and infrastructure issues. The idea was to avoid the common combination of scientist and policy maker, and to deliver explainers to current issues before discussing and arguing over positions and priorities of the different parties. The vibe certainly was a lot more relaxed in our session compared to the following ones, which I was not sad about. This format - a panel discussion with a live audience that was also live-streamed to Youtube and posted there for posterity - was new for me and a bit nerve-wracking, despite the chill atmosphere. But in the end, the event went very smoothly, thanks also to lots of preparation on my part to some guiding questions, which the moderator had sent us ahead of time.
Was it a success? I'll let you be the judge of that (the discussion is in German, unfortunately): www.youtube.com/live/8ngWuNH-xR4?si=RmlcYQ9dhxPe83Xx&t=56 Two weeks ago, I received my favorite email newsletters: the biannual sign-up call for Skype A Scientist. If you don’t know, Skype A Scientist is an organization that matches researchers interested in science outreach with school classes to talk about their areas of work. Twice a year, in summer and winter, researchers sign up with their field of work, what grade levels they’d like to speak with (pre-school through high school and even adult and senior groups), what languages they feel comfortable with, and a few other criteria. Then, they are matched with teachers or groups who are looking for similar things. The organization sends both an email, and you do the rest to set up a video call The idea came from an emerging distrust and denial in science after Donald Trump won the presidential election in the U.S. in 2017, Sarah McAnulty, the Executive Director of Skype A Scientist, told me in a podcast interview. The organization is based in the U.S., but it operates globally. I started participating in 2018, and have talked to two to five school classes per semester, in English and German and mostly in the U.S., about climate change and its impacts on food production, grasslands, and natural ecosystems in general, about the water cycle, and about environmental topics in general. Preparation usually starts with an email from me to the teacher introducing myself, and the teacher emailing me more specifics about their interests, or with specific questions from their students. These questions are always fascinating to me. Over the next few weeks or months, until our scheduled session, I would look up resources, find photos, and put together some slides for the class. I always try to make it interactive, so I leave room for questions or include questions of my own that we then discuss during the session. I would often be on a huge screen or projector wall in classrooms, but during COVID when everyone was at home, I sometimes had Zoom calls with students in their PJs lounging on the couch (not that I’m complaining, I wasn’t exactly dressed for work either). It's important not to overthink answers, but to keep them short and simple. “How fast can wind go?” middle schoolers from a science class in California asked me two years ago. The younger the students, the more mind-boggling their questions. “Where is the cleanest water on earth?,” 3rd-graders from Switzerland wanted to know last spring. Younger students seemed to be more easily fascinated by our natural world, while older students would often have more specific questions. High schoolers from the U.S. East Coast asked me in 2018, “How much does climate change affect wildfires?” and “What do you consider to be the thing most impacted by climate change and why?” It's important not to overthink answers, but to keep them short and simple. High schoolers are also often interested in my career path, and how I got to where I am, since many of them will soon start college. After our sessions I usually share my slides and resources with the teacher, and include a list of additional resources — websites, literature, or online tools — that I like to share for their educational value. This semester, I was matched with two elementary classes in Florida and Louisiana. For me, Skype A Scientist is about more than restoring trust in science. As a climate scientist, it’s also a bit of therapy. It’s hard to describe the amazing feeling when students ask me what we can do about climate change. It is restoring my faith in humanity that we are not doomed yet (along with unplugging from ever more toxic social media, like Twitter/X). In addition, it is a way to humanize science, to show that scientists don’t all wear white lab coats and goggles and look down from an ivory tower. We are people like everyone else (the sign-up form also asks scientists — optionally — about race and gender, as a way to match minority classes with scientists from the same group). We don’t always have an answer (lots of times, no one does). But most of all, it is a way to get students interested in becoming scientists and channeling their natural curiosity for the betterment of the planet. Their questions are very important for me, because they tell me what will strike their curiosity, and I know that I won’t tell them something they already know or that is way beyond their comprehension. I can tailor our session to their needs and make it interactive. These questions often also neatly segue into broader topics. For example, the question about how fast wind can go, of course means talking about tornadoes in Oklahoma (cue amazing photos!), but I would also focus on what wind is, why we have storms, and why it is important (think pollination or rain in the desert). The question about the cleanest water, that was a way to bring up water pollution and what it does to our environment and ourselves. Sometimes I don’t know the “right” answer (What is the most important thing impacted by climate change?!), or I’ll have to preface it with a qualifier that my answer is based my own, limited expertise. Whenever I don’t have a good answer, I try my best and then ask the students back the same thing, just to see what they would say. Participating is free and on a voluntary basis for everyone. If you want to support Skype A Scientist, you can sign up as a scientist, teacher, or another group, or become a Patreon. Skype A Scientist: www.skypeascientist.com
Podcast interview with Sarah McAnulty (Executive Director): ECCN Podcast ep. 2 The European Society of Agronomy biennial meeting covered research on soil health, reduction in chemical fertilizing and pesticides, and how to bring science and society closer together to accelerate innovation in sustainable production. Agriculture is going through a transformation in Europe. The European Green Deal and the EU's Farm to Fork strategy increasingly limit the use of chemical pesticides, such as glyphosate, and push towards nature-based solutions in weed and pest control. The war in Ukraine jeopardizes grain exports from "Europe's bread basket" and fertilizer exports from Russia, both threatening the global supply chain of food and agrochemicals. At the same time, consumers demand more local produce, which creates opportunities for regional markets, shorter supply chains, and products that cause fewer transport emissions. On top of this, climate change exposes crop and livestock production to more extreme drought, heat, and rainfall. Actionable research and development have a big role to play in the transformation of agriculture. Horizon Europe and its predecessor Horizon 2020, funding programs by the European Union, have been funding research aimed at bringing together researchers and practitioners to accelerate innovation in agriculture. For example, by 2027, the Horizon Europe Soil Mission will fund 100 so-called "living labs" and "lighthouses" across Europe to advance research and practices towards healthier soils. Against this backdrop, agricultural researchers met at the University of Potsdam, Germany for one week last August and early September, at the biennial meeting of the European Society of Agronomy. Embracing the increasing digitization of Agriculture 4.0 and the push towards more environmentally friendly practices, the conference ran under the motto “Diversification & Digitalisation – Trends that shape future agriculture”. As living lab researcher, I was most interested in collaborative, actionable research with farmers, conservation organizations, policy makers, and other non-scientist. As this was my first conference since moving back to Germany at the end of 2021, I was also eager to learn about advances in model development, agricultural production, natural fertilizers, and pesticide reduction on this side of the pond. Participatory and transdisciplinary researchParticipatory and transdisciplinary research involve the public and expert stakeholders and use their expertise, or simply the power of the crowd, to improve research. Participatory research can be used to augment and improve computer models. Citizen science projects, like the Mückenatlas at ZALF, or the Cooperative Observer Network of the US National Weather Service, are considered participatory research. A frontrunner in this research is INRAe, the French National Institute for Agriculture, Food, and the Environment. One challenge to combine information from participants with mathematical models, because the two rarely talk the same language. Marine Albert, a Ph.D. student at INRAe (France), and colleagues developed SMART variables to use in a vulnerability assessment for maize production. These SMART variables (specific, measureable,assignable, realistic, time-related, coined by George Doran in 1981) convert survey responses from farmers and are used in DPSIR, a quantitative model framework. Working with farmers as equal partners and reimbursing them fairly for their time was essential for her success. How should we measure transformation of agricultural systems towards sustainability? Sophie Plassin and colleagues (INRAe) identified gaps in assessing the performance of conservation agriculture and its ability to cope with climate change in temperate zones. Most methods, they found, are focused on the field or farm scale over short times (<5 years), without considering the “big picture” (larger-scale and longer-time). They also found, that assessments are too often focused on crop productivity with little attention to social and economic aspects. However, these aspects are important criteria for transforming the agri-food system, according to a recent publication of the EU Standing Committee on Agricultural Research (SCAR). Maryline Darmaun and colleagues (INRAe) worked with stakeholders to evaluate 14 methods to assess agroecological transitions, to develop a prototype for these transitions and then test it in a village in Senegal. Replacing chemical pesticides with alternative methods to control pests on fields, such as Integrated Pest Management (IPM), is another challenge in transforming agricultural systems. Much work has been done in labs, but testing methods on real fields involves research on a different scale. Sandie Masson (Agroscope Changins) and Nicolas Munier-Jolan (INRAe) developed IPMWORKS, a European network of 246 trial farms in 16 countries (e.g., the Julius-Kühn-Institut in Germany) to develop a holistic IPM that integrates crop rotations, mechanical weed management, precision pest management, and decision support systems to aid site-specific management (here is a video about their work). What difference can seasonal climate forecasts make in crop management? Marlene Palka (Ph.D. student at IPB Vienna and research assistant at IIASA in Austria) conducted on-farm experiments on four farms in eastern Austria, comparing crop management that followed her seasonal climate forecasts (forecasts for the next 1 to 12 months) to conventional management informed by seasonal averages calculated from observed historical data. Seasonal forecasts did improve decision making in general, but not so much in extreme conditions, like heavy rainfall, extreme heat, and severe drought. This is a common problem in seasonal forecasting, because extreme conditions are particularly difficult to forecast. NitrogenNitrate is a necessary fertilizer in farming, but overuse causes it to wash out of the soil into creeks, rivers and lakes. This is a major problem in conventional farming that uses synthetic fertilizer, because it can cause eutrophication of streams and lakes, and because fertilizer is expensive (both in the US and the EU, in part due to the war in Ukraine). However, this is also a problem in organic farming, which use legumes or manure fertilizer. Legumes are plants that help bind nitrogen from the soil or air (where it is the most abundant gas), store it, and release it when needed. Tackling practical hurdles in reducing nitrogen wash-out, Malick Ouattara, Ph.D. student at INRAe and AgroParisTech, worked with farmers, researchers, and advisors to develop crop mixes that require less synthetic nitrogen, reduce nitrate leaching, and use available nitrogen more efficiently. Ph.D. students Tsvetelina Krachunova (ZALF) and Florian Tröber (HTW Dresden) used ribwort plantain (Spitzwegerich), a legume, as cover crop and found 20 to 40% less nitrate leaching in fields with ribwort, a very good result (video about their research). Less leaching reduces pollution downstream and reduces costs of fertilization for farmers. Ribwort as forage has antibacterial effects in sheep stomachs and reduces emissions of N2O, a potent greenhouse gas, from sheep. However, ribwort seeds are expensive (ca. 200 Euro per ha), which makes an expensive source of forage. Its effects on other soil organisms are also largely unexplored. Farmers also need to remove ribwort as a cover crop before it matures and forms seeds or else its seeds will germinate and grow in the following grain crop. Shorter supply chainsGlobalization is evident in many supply and value chains in agriculture, Luis Lassaletta (Universidad Politécnica de Madrid) explained in her keynote talk. For example, in animal production, grain crops are used as high-protein feed. The grain is often grown in one country, but the fertilizer used on the fields is produced in another country, and the grain forage is eventually shipped to yet another country where hungry livestock are awaiting. This creates an imbalance, because livestock manure (rich in nitrate) accumulates far from where it was used to grow crops. This drives soil and water nitrification, while mineral nitrogen has to be produced in a very emission-intensive way to be used in crop production. Emissions and pollution could be much lower in shorter supply chains, where producers and consumers of agricultural goods are closer together. FoodSHIFT2030, an EU Horizon 2020-funded project, is working with administrators, citizens, businesses, and scientists to transform the agrifood system first in nine and later in 27 European cities, including Berlin, towards shorter supply chains, which could benefit local producers and create fewer emissions. Technical and technological aspectsThere is no shortage in technical and technological approaches to reducing agricultural emissions, creating shorter supply chains, and yet produce affordable food in a sustainable way. Senthold Asseng, who in 2021 took over the professorship in digital agriculture at TU Munich, discussed indoor vertical farming (such as infarm,www.infarm.com) as a way to allow year-round farming with fewer inputs, reduced pest risk, and yields that are “impossible in conventional farming.” Robin Lieb and colleagues (Julius-Kühn-Institut, Germany) tested “if pesticide-free cereal production is possible” in a project they called “NOcsPS.” They combined conventional and organic production methods by replacing chemical weed removal with mechanical weed removal (by farm robots) and by using less mineral fertilizer (they called this system MECS). Their method did reduce diseases, but also revealed problems with some fungi and weeds, which thrived on the mineral fertilizer. Intercropping grows two different crops in the same field at the same time. Wopke van der Werf (Wageningen University and Research, The Netherlands) explained, there are different ways to intercrop two crops, for example in alternating rows or by choosing crops that grow at different rates and don't compete for the same soil nutrients. This allows both crops to be harvested separately. Intercropping can reduce the spread of pests and diseases, and it increases the land efficiency ratio, which means the two intercropped varieties need less space to achieve the same yield compared to if both were planted separately. Intercropping systems differ based on where they are located. For example, Chinese systems benefit from cheaper manual labor for harvesting, which allows for a greater variety of crops to be combined. European systems with higher labor costs are restricted to combinations that are suitable for machine harvesting. Kairsty Topp (Scotland’s Rural College) studied intercropping in ReMIX, also an EU Horizon 2020-funded project (www.remix-intercrops.eu) and found that intercropping improved pest and disease control, Nitrogen storage in the ground, and increased yields by 20-40% compared to monocropping. Intercropping affects habitats of farm birds and other critters that live on fields, which is still largely unexplored and an area of active research, for example by Dirk Apeldoorn (Wageningen University and Research). Modeling, decision support, and experimentationLab and field experiments, like NOcsPS or ReMIX, help improve agricultural models that predict crop yields and ecological benefits of changes in agricultural management. These models can be connected to user interfaces that allow managers to use them to improve management decisions. Mathieu Delandmeter (University of Liege, Belgium) evaluated how well the French STICS model simulates biomass production, evapotranspiration, yield, plant nitrogen, and carbon exchange in a four-year crop rotation in Belgium. Ashifur Shawon, researcher in the project RYE-SUS (Julius-Kühn-Institut, Germany), tested four different calibration strategies for the crop-growth simulator DSSAT for German growing conditions using crop, climate, and soil data. Frauke Geppert (ZALF) works on the German Naturschutz-App (NatApp 2.0), a smartphone and web app co-developed with farmers that allows planning, tracking, and compensating biodiversity measures on farms (so-called agro-environmental schemes). Alesia Perego (University of Milan, Italy) described LANDSUPPORT, a land management tool with a simple user interface that that is connected to the ARMOSA model to aid decision making. What to take away?ESA 2022 tried to connect the technical aspects of agricultural research, social science studies, and showcase approaches to transfer scientific advances into practice. The conference motto, “Diversification & Digitalisation – Trends that shape future agriculture,” nodded to the challenges of our time for sustainable food production, both poised to change what foods we consume and how we produce them.
Much of the conference still focused on production aspects of the transformation to sustainable agriculture, appearing like we can “science” our way out of the climate crisis. Perhaps that's the case, but for scientific innovations to succeed in the real world of farm management, policy making, and food production, it requires collaborative between scientific, political, private sector, and societal stakeholders. It seems, participatory, transdisciplinary, and living lab approaches are still a niche (11 out of 242 poster and presentations had „participatory”, „participation“, „participating“, or „participated“ in the title or abstract. None contained “living lab”.). I’m excited to see what ESA 2024 (in Rennes, France) holds. With INRAe as organizer and Edith le Cadre as the new ESA president, I’m hopeful that living lab and other participatory approaches will play a larger role. A call for contributions to the ESA 2024 program will be available on the ESA website: www.european-agronomy.org Related reading: Reallabore in Agrarlandschaften: Gemeinsam mit Praxis, Wissenschaft und Politik zu Lösungen für die Transformation des Agrarsystems (2022, German) The next time you are in western Oregon, I suggest you visit the Willamette River. Winding through lush, green forests and magnificent wetlands bursting with native fish, it is an unbelievably beautiful part of nature. (There are hiking trails and campgrounds, too.) It was not always like that. The river used to be deprived of wildlife, because foresters cleared it from trees that fell into it, thinking they would help the ecosystem. It took years of research to understand that those dead trees in the water created the very habitat that made the river teem with life, and even more work to reverse what was once thought was right. I grew up feeding sheep, making hay, and harvesting apples on my family’s small farm in eastern Germany. I knew milk didn't come from the grocery store, and neither did bread or jam. To enjoy a good breakfast, I knew a farmer had to raise a cow, nurture an orchard, and grow a crop from the soil and the water God gave us. Through research, we learned we could produce more by using fertilizer, fight weeds and bugs with herbicides and pesticides, and grow in new places through irrigation. We produced more abundant, more affordable food, and fewer people starved. Somewhere along the way, however, things went wrong. Wells dried up. The chemicals we put in the ground started polluting our rivers and lakes, killed fish and plants, and disrupted the food chain that all life depends on. That which feeds us was starting to harm our planet. Something needed to change. “Love your neighbor as yourself” is an often-cited passage from the Bible. To me, that has never meant just my literal neighbor, but everyone around me, everyone I interact with, and everyone who is affected by what I do (or do not do). I care for others as I hope they would care for me reciprocally. But what if that neighbor is not a fellow human, but the earth, the foundation our lives depend on? Earth provides me with clean air to breath, clean water for my morning tea, and healthy soil to grow the food I eat and the cotton that makes my clothes. It does that for all of us, so why shouldn’t we care for it, too? When God created everything, They gave us dominion over creation. But God also created us as caretakers of that creation, and I’m not sure we are doing such a good job with that, given that species are going extinct, oceans are becoming more acidic, and rainforests are disappearing at rates never seen before. Science tells us we are hurting our planet. Some people are convinced that humans don't have the ability to change the planet, only God can, and thus, all that happens happens for a good reason. I disagree. Not only do we change our planet, God gave us brains to understand our actions and to change our path when we see that we are moving in the wrong direction. Global change, the collective term for what is occurring to our environment, from climate change to species extinction, is happening because we are moving in the wrong direction, but also because we are not changing course. Through science, we know that certain plants help enrich the soil without chemical fertilizer, that we can reduce weeds without glyphosate, and that flower strips in crop fields nourish birds and pollinators that in turn reduce pests without pesticides. Science gives us tools to change. We just need to conjure up the will to do it. This essay was originally published in March 2022 in AllCreation.
Since November last year I'm hosting the ECCF podcast, a science podcast that covers climate change research, science communication, and gives career advice for grad students and young professionals. Most people I talk to have not had a straightforward career path that led them to the jobs of their dreams. With this podcast, I'm exploring how they did it and what challenges they faced. I recently uploaded episode number six, finished in my make-shift sound booth at home, thanks to COVID-19, so I thought why not go through each episode, summarize them, and share some lessons learned from creating this podcast. 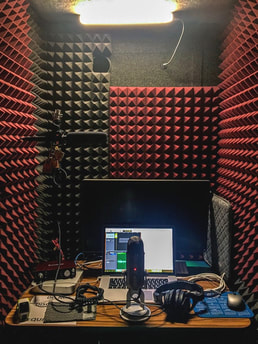 Narrating in a sound booth at the Texas A&M University library Narrating in a sound booth at the Texas A&M University library
Episode 1 - Dr. Kristen Weiss (science communicator)
November 21, 2019 (25:57 min) Kristen is the communications coordinator for the US Long-term Ecological Research (LTER) Network at US Santa Barbara. She is a video producer, photographer, and blogger with an impressive science background. She earned a Ph.D. in policy and natural resource management in Australia and did a science communication postdoc in California. She visited Texas A&M to speak in our departmental seminar series "From Knowledge to Action" about her work at the LTER Network. Kristen was actually my second interviewee, but because the launch of our podcast lined up well with her participating at an all-female sailing expedition to study ocean pollution, I decided to put her first to advertise the expedition in the outro and the episode description. While her interview was an improvement over the first one (with Sarah McAnulty below), the episode still had plenty of obstacles. The biggest one was recording the intro, intermission, and outro, to bookend and loosen up the episode. My office was neither quiet or echo-free enough for that, so I booked a one-person, very dark sound booth at the university library for two hours one day after work, thinking that would be plenty to record a few minutes of me reading some text off a screen. Needless to say it wasn't, because the slightest pause, slip of the tongue, mispronunciation of a word, or other proverbial hiccup put me back to the starting line. I learned to cut and paste together good segments, but even then, small changes in volume, pitch, or speed would turn the result into a patchwork of sounds rather than fluent lines of spoken word. An even when everything was recorded in good quality, I sometimes found that what I said didn't quite sound as good as I thought when I wrote it, or I wanted to add one piece of information, and scrap the recording to do it all over again. 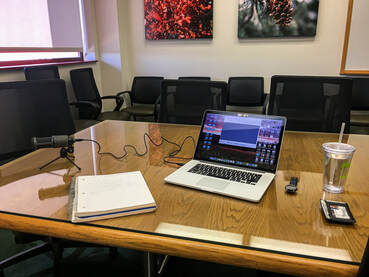 My recording setup for Sarah McAnulty. Far from perfect, but it did the trick. My recording setup for Sarah McAnulty. Far from perfect, but it did the trick.
Episode 2 - Dr. Sarah McAnulty (Skype A Scientist)
December 23, 2019 (24:31 min) I was really excited to interview Sarah! She is the founder and Executive Director of Skype A Scientist, a global organization that connects scientists with school teachers for classroom chats about their research, what it means to be a scientist, how they became one, and much more. I've been a participant of Skype A Scientist since early 2018 and talked to over a dozen school classes since then, about my work, myself, the impacts of climate change, and what we can do to adapt. Like Kristen, Sarah was on campus to give a departmental seminar about her work as a squid biologist at the University of Connecticut, and of course to talk about Skype A Scientist, which was also the focus of this podcast episode. Unlike Sarah, who had been on NPR's "Brains On!" and many other podcasts, this was my first podcast interview ever. So, needless to say I was nervous. I had interviewed people for newspaper articles before, but the technology part here was all new, and the thought of messing up an interview with Sarah McAnulty was a bit terrifying, despite much testing and practicing. First, the microphone I borrowed (an AudioTechnica AT2020+USB, for audiophiles) was uni-directional (a so-called cardioid recording pattern), perfect for one person speaking but not so much for a conversation between two people. I solved it by pointing it upwards, which resulted in some echo from the ceiling, though. Second, Sarah had quite a strong voice, louder than mine, and the mic was positioned closer to her, so during editing I had to painstakingly lower the volume when she spoke and raise it again when I spoke. Apple Garageband is pretty intuitive to use, but this took forever. And third, the fridge at the end of the conference room we recorded in! Barely noticeable during the interview, it left a very annoying buzz on the recording. Garageband doesn't have a noise filter, but thankfully Audacity does, which took care of this. When all was done, we posted the episode two days before Christmas.
Episode 3 - Dr. Jeff Martin (bison researcher)
February 13, 2020 (13:29 min) At the time of our interview, Jeff was a doctoral student in a department one floor down from me (he just defended, woohoo!). His research on the effects of climate change on bison body size across the Great Plains is amazing, and it overlapped quite a bit with my work on cattle ranching, so naturally I wanted to talk to him. Thanks to a brand-new Blue Yeti (a Christmas gift from my wife), audio issues were a thing of the past. However, pressed for time, I didn't have a good set of questions when we got together. So as scientists do, we got into the weeds of our work and got sidetracked way past the interests of any listener. Thankfully, Jeff, despite being in the middle of thesis writing, agreed to record the entire interview again, this time with a list of questions, less jargon (we tried), and more commitment to staying on topic. The interview went well, but I made the unfortunate decision to try and make this a shorter episode focused primarily on his research results. That meant I cut out much of him talking about the relationships he had to form with bison ranchers and organizations to get access to grazing land, animals, and fossil records. A big mistake in retrospect, because it was essential to the success of his work and is often undervalued in our pursuit of fast results. You can read more about Jeff's work on his website, including many articles about his work he wrote for a general audience. 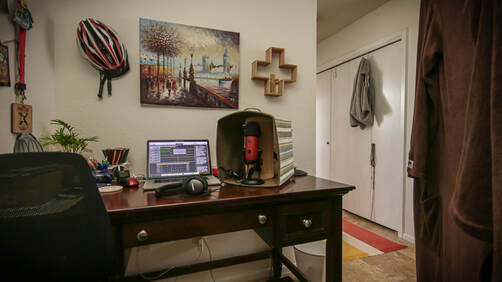 My make-shift sound booth at home. My make-shift sound booth at home.
Episode 4 and 5 - Dr. Jessica Whitehead (North Carolina's Chief Resilience Officer)
March 27 and April 6, 2020 (29:19 min and 38:38 min) These two episodes were less work for me, because my colleague, Dr. Adrienne Wootten, a climate scientist in Oklahoma, took care of the interview part. Jessica's career path is anything but straight and her day job was nothing short of fascinating, so Adrienne's chat with Jessica was long. So long in fact, that we decided to split the interview into two parts (and still produced the two longest episodes at the time), covering her career path in part one and her day job in part two. We ended part one on a small cliffhanger, and posted them about ten days apart. Jessica's interview presented two new challenges. One, we needed Jessica's boss' approval for the interview (because she is a federal employee), and two, it was the first one we recorded remotely, not in person (not because of COVID-19, but because of the distance between Oklahoma and North Carolina). Adrienne used Zoom, which records audio and video on the host's computer (set the location under Preferences > Recording). Even better, audio streams from each participant can be saved in separate files (also under Preferences > Recording). This makes fixing issues with quality, volume, or background noise much easier. In noisy environments, it helps to wear headphones with integrated microphone, like Apple's EarPods, instead of using the computer's microphone, because the headphone mic picks up a person's voice better and reduces the ambient noise. Bluetooth headphones are not a good idea, because they cause delays and chop off the beginning of a person's audio, Adrienne and I found out the hard way. We assume the bluetooth connection enters a kind of power-save mode if a person doesn't talk for a while (which was the case here), and it needs a second to "wake up" when the person does say something. We did not test with bluetooth headphones and only found out after the interview that Adrienne's audio turned out choppy and distorted. So, corded headphones with integrated mic is the way to go. Thanks to COVID-19, I had to record intro, breaks, and outro from home, which made logistics easier, but recording harder. Even though our apartment is fairly quiet, the occasional train, plane, or car would still torpedo my hard work, in addition to a noticeable echo off the walls. The solution was a make-shift sound booth constructed from a collapsable box and a blanket hung from two lamp posts to reduce the echo. It was inspired by Michael Barbaro's setup for "The Daily" podcast, which, like UCS's "Got Science", Pew Research's "After the Fact" and every other podcast I listen to, had to content with the same problem: working from home. To avoid our neighborhood's noisy A/C units, which slowly woke up from hibernation (we had a very warm March), I recorded mostly in the mornings. I can't be sure, but I'm just going to tell myself that all this effort made my voice extra crisp and the episode even more fun to listen to.
Episode 6 - Dr. Hailey Wilmer (social rangeland scientist)
May 6, 2020 (38:54 min) Hailey is a social scientist who studies decision making in rangeland management. With a bachelor's degree from Cornell and a Ph.D. from Colorado State University, she was a postdoctoral fellow with the USDA Northern Plains Climate Hub in Fort Collins, Colorado. She was part of the Collaborative Adaptive Rangeland Management (CARM) project, which is what I wanted to talk to her about. CARM is a large-scale, long-term field study in Colorado that involves ranchers and scientists to study the effects of different rangeland management styles on the health of grasslands and the economic benefits for ranching. It epitomizes the idea of science co-production, the collaboration of scientists and stakeholders to better inform decision making in the real world (Djenontin and Meadow 2018 provide a good "how to" guide). I wanted to talk to Hailey, because I love her kind of work. It brings together academic researchers, government agencies, NGOs, and ranchers, and combines the strengths of systematic inquiry (you know, scientific research) in a range of disciplines from social science and meteorology to agronomy and ecology, with the expertise of decision makers on the ground. The episode with Hailey did not really make any trouble, so maybe by now I have aced the Podcast 101. Like Jessica Whitehead, Hailey (a federal employee) had to request her boss' approval (a formality in both cases), and we recorded the episode during a conference in Denver that we both attended back in February. Hailey and I met at the end of a conference day, I brought my Blue Yeti, and we found a quiet room in a corner of the conference hotel. The audio was excellent, and the only mishap you will hear at the beginning, was when we knocked against the table a few times while the mic was recording. Effective communication is not only important when sharing your research with others. Its objective is to assist collaboration, to make science more applicable and scientists more sensitive to the concerns and values of others. (Srinivas 2017) Climate change is a huge, complex problem that no one can solve alone, and tackling it means scientists across disciplines have to work together and to understand each other. But that can be difficult for many reasons: different culture and traditions, differences in terminology (or the same terminology but different meanings), or expertises that don't overlap much, to name a few. A social scientist, an ecologist, and a meteorologist might study climate change, but from very different perspectives. In order to help a city planner create green spaces to reduce the urban heat island effect and keep cities livable for an aging population, all need to seamlessly work together. In the U.S., part of the solution to this have been boundary organizations like the USGS Climate Adaptation Science Center network, NOAA's Regional Integrated Sciences and Assessment teams, and the USDA Climate Hubs, that work with natural and cultural resource managers, cities and communities, and farmers and ranchers, to help them adapt to increasing more severe droughts, more unpredictable seasons, and more extreme heat, due to climate change. For those that don't have one of these centers around (although, they do cover a big chunk of the U.S.), a colleague and I wanted to help people get started. Cait Rottler, a researcher at the USDA Southern Plains Climate Hub in El Reno, Oklahoma, and I hosted a 2-hour workshop for researchers and stakeholders to become better collaborators. We were at the annual meeting of the Society for Range Management, a meeting of rangeland and ecosystem researchers, private sector companies, ranchers, Native American Tribes, and agency staff from the U.S. Fish and Wildlife Service, the Bureau of Land Management, and the Department of Agriculture. There are many barriers that keep people from working together, for example our limited understanding of on-the-ground decision making (which I wrote about here, here, and here). In this workshop, we wanted to focus on the language barrier that exists within the research community and between researchers and decision makers. On the left is a quote from a paper about DNA analyses on African skeletons to understand ancient human migration in Africa, published this January in Nature. On the right is a quote about this study from a news article in the science section of the New York Times. If you're like me, you found the text on the right easier to understand. The text on the left is clearly written for experts like anthropologists, geneticists, and bio-molecular engineers (the research fields of the authors). The text on the right is for an interested, but non-expert audience. It is less specific but uses fewer technical terms and more general phrases that a broader audience can more easily understand. Technical language can convey a concept or message very efficiently, but only to a small group of experts. In research, we often work with peers in our field and thus communicate in ways that exclude a broader audience. Our workshop was intended to help researchers and stakeholders communicate to each other. Comparing scientific papers and popular science articles raises another issue: how do we present our work. The classic IMRAD structure (Introduction-Methods-Results-And-Discussion) used in scientific journals everywhere is not how we should communicate our work to peers, stakeholders, or indeed anyone. In our workshop, Cait and I used the Compass Message Box concept to illustrate how research can be reframed for a range of audiences, to describe:
Here is what my research at Texas A&M University may look like, reframed for a broader audience. My advisor, David Briske, our colleague Matt Reeves (U.S. Forest Service in Montana), and I study the impacts of climate change on cattle production in the Great Plains, specifically the consequences of more frequent and intense droughts on grasslands, through the lense of ecology (David and Matt) and a climate science (me). Thanks to other colleagues (John Ritten at the University of Wyoming and Amber Campbell at Kansas State University) we also looked into the economic impacts on ranching and into societal challenges of adapting range management to climate change. In short: Quite a mouthful! Let's try to look at it in a different way. Most importantly: Who is our audience? Problem, solution, and benefits are different depending on who we talk to, even if the broader issue is the same. Discussing drought with a rancher is very different from discussing drought with an engineer ... or a state legislator. Next, I broke down our research into the five segments of the Compass Message Box. What might be the most relevant issue for legislators? Why should they care? Drought has an economic impact on ranching, and with that an economic impact on their state budget and the welfare of their residents. What are the concrete problems? Clear language is essential, and some context, like comparing future droughts to significant historic ones, could describe the problem more clearly. Depending on the audience, we could adjust our wording to include or exclude certain phrases, such as "climate change". By now, though, many farmers and ranchers recognize climate change in their operations, talk about it, and want answers. So, well-informed legislators (or their staffers) even in conservative states might be okay with talking about it, too. Now to the consequences, why it should matter to the legislator. Note that the language is more science-y, but because of the context we created previously, most of this should be clear. I focus on economics, because cattle ranching is a multi-billion dollar industry in Texas, and I imagine representatives are most concerned about economic impacts and tax expenses on livestock insurance or flood damage, before thinking about protecting natural habitats and endangered species (which we mention later). What are my suggestions for solutions? This needs to be phrased carefully to not appear like I'm the expert on this (which we're not). I am merely suggesting solutions that could help the problem from my perspective. Phrasing solutions should take place with a team spirit in mind - I want to help the legislator and their team solve the problem, and I acknowledge that other interests might conflict with mine, and I might not get it my way. How does all this work benefit Texas and Texans? I try to point out how my proposed solutions can help reduce future costs due to droughts, the problem I stated initially (also, droughts are more concrete than climate change, so I use that) and what else might benefit. This was only one example we gave our workshop participants. Not all research is relevant for legislators, but might be relevant for or could benefit from input by engineers, sociologists, ecologists, economists, city planners, or policy makers on local, federal, or international levels. What we aimed for was to inspire our participants by the multiple ways their research could be enriched and expanded, and give them some tools for how to do that. Since this was a workshop and not a lecture, now was our audience's turn to apply some of what they just learned. Taking a page from a workshop for scientists about communicating with the media that I had hosted a few years ago, we had planned an interactive practice session. We split our audience into groups of three, such that – ideally – no two people in one group knew each other (or at least didn't work in the same field). Then we gave assignments to each of them: Person 1: Ask person 2 general questions and more specific follow-ups about their work and their professional background, challenges they are facing and how to overcome them Person 2: Answer these questions in a way that uses as little jargon and technical language as possible Person 3: Observe the other two and recognize what they do right and wrong After about 4 minutes, we asked each group to wrap up and for person 3 to briefly share their observations with the other two in their group. Then everyone rotated into a new role, and we started over. We rotated 3 times, then re-shuffled all groups and rotated another 3 times, so that everyone was in each role twice, but each time with different partners. If we had more time, we could have repeated this process again. Feedback During the practice part, Cait and I went around the room and listened in on how everyone was doing. Some participants really struggled finding the right words and cutting down on jargon (ranchers and federal agency officials as much as researchers). Cait and I were worried about what we were putting people through, whether our approach actually made sense, or if this activity would actually deter them from working in interdisciplinary groups, given how hard it. Thankfully, that didn't happen. Participants really liked the workshop and thanked us for putting this together. Most agreed, that yes, it was difficult to talk across disciplinary boundaries, and because of that they rarely do it. However, this workshop pushed them out of their comfort zone and to talking across disciplinary boundaries. It also helped them see their work and the value it has from someone else's perspective and understood how their work was important to others, which felt very motivating. Not least, one person said, and others agreed, that they found new potential collaborators in researchers they normally wouldn't talk to, but probably should. Friday.
Let's talk for a minute about generational collaboration in research. This morning, before going back to coding, I met with two younger research scientists and their boss, a senior professor. They do ecological systems modeling in the Department of Wildlife and Fisheries, one floor down from my office. One of their projects tries to understand the seasonal movement of the Invasive Sugarcane Aphid, a bug that damages crops, with the goal of creating forecasts and warnings for farmers who can then apply pesticides more targeted. Their work is not too different from what we do, so they were interested in learning about what we do. We had a wonderful, three hour long conversation about our project and theirs, and only stopped because, despite the jaffa cakes they brought, we eventually got hungry for lunch. The way the three described their work made me think about how different generations often approach problems differently. The two researchers are much younger than their boss and probably grew up in a time when computers were ubiquitous in colleges and maybe even schools. They know who to code, run models, and build web interfaces for users to get information over the internet. The professor, on the other hand, did his early research using punch cards (if you're under 20: punch cards). A simple calculation of data, not more than a few lines of code in today's world, would require a stack of punch cards that needed to be inserted in a machine and took minutes to process. The obvious comparison for me – thanks to this week's 50th anniversary of the moon landing – is that of the Apollo spacecraft computer to the super computers we carry around today in our pockets as smartphones. Their situation reminded me of my own. They're are young tech wizards, bursting with ideas and enthusiasm. The professor, much like my supervisor, has decades of wisdom and the accumulated expertise of thousands of books and papers he read and wrote over the years. Much like interdisciplinary teams, inter-generational teams, in my opinion, can be incredibly innovative and efficient, but only if we allow ourselves to admit that we need each other. Us young(-ish) folks are tech geeks, fluent in R, NCL, Python, and GitHub, and full of ideas for tools and gadgets, but often lack the experience and context what to innovate for. We like to make cool stuff for cool stuff's sake. Our supervisors, on the other hand, might lack some technical skills, but they know much better what problems need to be addressed. ----- And that's a wrap. This was one week of work, and it was fun for me to write. If you found it insightful and/or fun to read, please feel free to drop me a note, and I might do this again in the future (maybe during a conference or workshop). Thursday. Once a month, I get a special email from the National Oceanic and Atmospheric Administration's Office of Communication in Washington, D.C. As a federal agency, part of NOAA's job is to provide environmental information to the public. To do that, NOAA has data portals, like ncei.noaa.gov, and issues forecasts, warnings, advisories, and general press releases, for example through its website www.noaa.gov and via email, which are often published by media outlets. NOAA also holds press calls with their own scientists for journalists to learn about and discuss current topics that relate to weather and climate. And that's what this special email was about. This morning was such a press call, and I attended as listener. Today's call discussed the recent heat wave in Europe (June set a new record there as the hottest recorded June ever, surpassing the previous record by almost 1ºC or 1.8ºF) and conditions and outlook in the U.S. For me as a researcher and science blogger, these calls are really interesting. They're a good way to learn about current developments in the fields of weather and climate, and they're great to experience how scientists and journalists interact, what vocabulary, jargon, and graphics are common, to track what information makes it into the news, and to understand the news cycle in general. Clear graphics are essential, and ahead of time NOAA publishes a PDF with presentation slides that their researchers discuss on the call. These figures could end up in Tweets or Facebook posts (with citation of course), so communicating a clear message is key. Short summary statements in the slides can also get copied into tweets, or make headlines or highlights in an article. Here are some examples: But good graphics are only half the story. Answering essential questions with confidence and good language is also key in these calls. What, where, when, why, who cares, and so on, without diving into methodological details or listing all the limitations of the results (although, touching on them might not be a bad idea).
Being too much of a scientist (i.e., going on and on about minute details and using too much jargon) you could run the risk of "losing" a person, or even worse, make them misunderstand and misinterpret important information, and then unknowingly misinform millions of people. One of the journalists on the call, Seth Borenstein, writes for the Associated Press, and his reporting from today (all accurate by what I could tell) was published by the Washington Post, several regional news organizations in the U.S., and even an Italian news website. After 45 minutes, I got back to my own research, made some more progress, and at the end of the day (literally, 5.45 pm) finally got some graphic results myself. They're not quite ready for sharing, yet, but they generally suggest that in the next decades, drought years similar to 2011 or 2012 could occur much more frequently, with extremely dry or wet years representing up to five years per decade in the Southern Plains, especially after the 2050s, and one to two years in the Northern Plains. I still have a lot more analysis ahead of me, most importantly to understand what this means for ranchers, but this is a very important and valuable step. Here are Friday, Monday, Tuesday, and Wednesday. And if you wonder what this about, here is the intro blog post. Wednesday. Getting my script from yesterday to work almost went into day three. Almost. At 5.17 pm, after writing, testing, and debugging 983 lines of code, all errors and typos were corrected, and the script worked like a charm. Sadly, there is not muchto show, yet (also because I have to double-check the results). So in place of graphs and maps, this is what my two monitors looked like for most of today and yesterday. The one the left has Safari running R Studio, which I use to write code and manage files. The one on the right has three blue Terminal windows up and a data viewing app. Terminal is a Mac OS tool that emulates a command-line interface, which I use to tell the computer which files to run and to see some results. The fourth window, the data viewer, is Panoply, a very handy app by NASA to view NetCDF data, the type of data I work with. It comes in handy when I check results.
Despite the looks, my computer doesn't actually do much work. All of my commands and every line of code are sent 360 miles north to the South Central Climate Adaptation Science Center at the University of Oklahoma. There, all our data and most of my code is stored on a data server. Folks there also have NCL and several other programming languages, which makes our life here a lot easier. A good day always becomes better when it ends well. On the third Wednesday of every month, the Texas A&M Postdoc Association organizes a "networking event," a fun hangout with fellow postdocs to chat over snacks and drinks at a bar or restaurant in town, courtesy of the organization. It's a good way to meet peers and make friends, to bring up workplace problems, or just to talk nerdy to fellow nerds. I always enjoy these gatherings! However, today I had to pass it up for something even better – a dinner at an Italian restaurant with my wife. Here are Thursday, Monday, and Tuesday. And if you wonder what this about, here is the intro blog post. A quick note about the heatwave that is bound to hit many parts of the U.S. starting Thursday. If you live between Oklahoma and New England, it will get much warmer than usual in the next few days. Please avoid staying outside for long periods of time, and if you do, make sure you take a water bottle, put on a cap, and try to stay out of direct sunlight. If you want to know how climate change is changing the odds for heatwaves like this, check out yesterday's episode of the "Got Science" podcast by the Union of Concerned Scientists. Tuesday.
Every Tuesday and Thursday morning, I join a group of colleagues for what we coined "The Write Stuff," a writing group. We meet down the hall from my office in a conference room with large windows that overlook a beautiful garden, and spend two hours not chatting (mostly), but working on whatever everyone is working on. It sounds banal, but it's incredibly effective. The peer pressure of "Everyone else is working!" really makes you push through and avoid distractions. Also, the room is a pleasant change from my windowless office situation. Coding, finally. My goal for today was to write a script that analyzed rainfall projections for the next 80 years (2020 to 2099) and find years with extremely high and extremely low amounts of rainfall in the Great Plains. We found previously that rainfall variability is very different across the Great Plains. For example, in the Southern Plains, annual rainfall can vary a lot more than in the Northern Plains. Now we were interested in whether these super dry and super wet years will occur more or less often in the future. Specifically, we wanted to see if the frequency of years and the number of consecutive years with rainfall of more than 20 percent above and below the decadal average will change over time. Two assumptions were important for us going into this. We assumed that ranchers are used to some degree of year-to-year variability - they could handle some wet and dry years. But the really bad ones, especially when several occur back to back, like the droughts around 2012 or in the late 1980s, would be a real challenge. Because of that, we chose a threshold of 20 percent above or below the decadal average. It's an arbitrary value, really, and we'll change it once we find a more meaningful number that's based on previous studies. But for now we'll run with it. We also used an average that will change every decade, instead of one that runs from 2020 through 2099. Why? Because of our second thought: whichever way things will change, even if it continues to get drier, ranchers will find ways to adapt to a new normal over time, just like they have in the past. Using something like a running average will account for this. Now, of course a drought is more severe the hotter it is. So looking at rainfall without temperature will only give us half the picture. But for now, it is the first step to understand the effect of climate change (and climate variability) on ranching. We will repeat this process with temperature, and eventually with a suitable drought index that combines temperature and rainfall. Once we had this figured out, the real challenge was writing the script, telling the computer what to do. I am using a programming language called NCL, which stands for NCAR Command Language (and NCAR is short for National Center for Atmospheric Research in Boulder, Colorado – we really know how to make things complicated). NCL is a programming language specifically for climate and model data, and widely used around the world. I had written a script a few weeks ago that did something very similar, only with monthly data that were compared to rainfall observations, and three thresholds, 10, 20, and 40 percent, instead of one. So this should be similar, but simpler. It's always easier to have a foundation to work from than to start from scratch, because some parts stay almost always the same. Most scripts have three parts: (1) open a data file and extract the necessary variables, (2) process the data in a certain way, and (3) save the result in a new data file. Some scripts create graphs or maps instead of data files, or in addition to it. Writing a script is like giving a blind person directions for where to go. The computer knows basic operating rules, but it doesn't know what you want to do. It knows pre-defined commands that are hard-wired into the language, like how to open one or more files and how to add or subtract, and basic rules, for example don't divide by zero. But from there it is up to the programmer to make sure the computer does what it should. The smallest typo, a comma instead of a period or a space where there shouldn't be one, can crash the program, or worse, give out incorrect results without anyone noticing. I went step by step, wrote some code, ran it, checked the result, debugged if necessary, ran it again, checked again, wrote some more, ran it, checked it, and so on, until eventually, the script was complete. Or rather, will be complete. This process can take all day, or longer. After 687 lines of code and eight hours of staring at a screen, I was square-eyed and decided to call it a day and unwind on a long run. Tomorrow is another day. Here are Wednesday and Monday, and if you wonder what this about, here is the intro blog post. Monday.
The nice thing about working at a big university is there is always something happening, even during summer break. This morning, a professor from Ethiopia, Dr. Seifu Tilahun, who was visiting the college, gave a seminar about irrigation challenges in Ethiopia at the Borlaug Institute, one building over from my office. It's always fascinating to learn about research in other countries, and to discuss common ideas and challenges. Similar to the U.S., water quality in agricultural areas is a big problem in Ethiopia. Heavy rainfall washes crop fertilizer into streams and lakes and pollutes the groundwater, often the only source of drinking water, especially in rural areas. Practices that can reduce erosion and over-fertilizing, like no-till farming, are known and available, but adoption in the real world takes a long time, no matter how much they make sense to ecologists and economists. Back in my office, I had to sort out two things before I get started with coding. The first involved paperwork and some physical exercise, two things I got used to quickly in a large department like mine. I needed to register for a coding workshop on campus in August, but I didn't know how pay for it. Most faculty have work credits cards, but for some reason I didn't. So, a quick walk to our business admins in another building, and a few signatures later I had a temporary credit card and could register for the workshop (sadly, I'll have to return it tomorrow). The second involved Dr. Cait Rottler, a fellow postdoc in Oklahoma with the Agricultural Research Service, the research branch of the U.S. Department of Agriculture. Cait and I are planning a science communication workshop at a rangeland conference next February in Colorado. Good communication is important in research, so that scientists from different fields understand each other and work well together. Cait and I both work in climate change adaptation and know what a challenge this is. More than probably most areas, climate change is one where collaboration between disciplines is key to get things done, from engineering to social sciences to economics and ecology. And our workshop will help with that – or at least that's what we think. Today was the deadline to submit proposals – and with most things that have a deadline, we submitted it in time, but only just :-) We should find out in September if our workshop concept got accepted. Eventually, after a late lunch and much later than I had hoped, I sat down to work on my data analysis. I only had about three hours before my day was over, which isn't enough to start coding. But that was enough time sketch things out and get started. It's important to know the bigger picture and to develop smaller goals, before starting to write the code to get there. That's what I did today, and tomorrow I will home in on this more. Here is Tuesday. Wonder what this is about? Here's the intro blog post. High school students on Skype a Scientist have asked me a few times what an average day looks like for me. But it's hard to find an "average" day, so what I'll do instead is describe an average week. This week should fit pretty nicely.
If you read my About Me page or my Research page, you know I study how climate change affects cattle production in the U.S. Great Plains, a large agricultural region in the central US, between Canada, Mexico and the Gulf Coast, the Rocky Mountains, and the Mississippi. I study data to understand how future changes in temperature and rainfall affect where and how well natural vegetation grows in the Great Plains. Because we're concerned about ranching, I'm not so much interested in shrubland and forests, but mostly grassland, which ranchers use as feed for their cattle. I'm mostly a data analyst, and our first goal is to publish our work in scientific journals so other researchers can read about it and use it in their own work. These journals are like newspapers for scientists, except they're much harder to understand. We also go to scientific conferences a few times a year to present our work, meet colleagues, and learn about their research (and we get to see some fascinating places, too). We just finished working on two papers, about how past droughts have affected cow numbers in the Great Plains and how grasslands in the Great Plains will change in the future, and we submitted them to two journals for review. It'll probably take a month or so until we hear back from them. As one of the leaders in our project, I am also interested in the bigger picture, and I am responsible to determine what to do next. Last week, after we finished our second paper, my postdoctoral advisor and I brainstormed about what to do next. One thing we are trying to understand is what our projections mean for ranchers and their operations. Our data are really just millions of numbers, for every year from 2020 to 2099 arranged in a raster grid across the Great Plains. They can be really abstract if you don't organize them in a smart way. That's what I'll do this week, plus dealing with smaller things that occur each day. Here's Monday. Every year on the last Saturday of September, the University of Oklahoma hosts a five kilometer run, the Fun Run. Every year around 650 runners participate, and each of them have their own goal. Some just want to push their strollers in more of a five kilometer walk and have a good time, some enjoy the community of runners and maybe push themselves a little. And some switch to race mode, eat pasta the night before, put on their Dri-Fit running clothes and their GPS watches with heart rate monitor, and run like they’re trying to set a new world record. I fall into this last category. I’ve been running for about 13 years now, ever since I started college and my class schedule and homework made it difficult for regular wrestling practice. Running is something I can do on my own, at my own pace, whenever I like it, and wherever I like it. I most enjoy running in the morning, through parks and side streets, when the air is crisp and cool. There is nothing more beautiful than to start the day with a run. I like hearing birds chirp, and I watch the world around me slowly wake up. It motivates me, it floods my brain with fresh air and energizes me for the day ahead. I didn’t use to care much about pace, or technique, or food, or racing, until I realized I was actually quite good at it. Four of my five Fun Runs I finished among the first ten. My first half marathon in 2015 I finished twelfth out of over 1,100 starters. And in my first marathon this year, in Oklahoma City, I finished 37th out of 2,200. I only signed up to run a half marathon, but because Mr. Geography lost his sense of direction … whatever. I ended up running the full marathon. Finishing my dissertation and applying for jobs is all I can think about these days. And as I was running this year’s Fun Run, I noticed it felt a lot like working towards my defense and applying for a job. Think about it: You learn new things, delve into new techniques, push yourself to the limit, practice and improve for a really long time, and eventually it comes down to meeting expectations and doing better than your competition. At the Fun Run, I lined up at the front of the race with a group of other fast runners, and we quickly pulled away from the rest of the field. By the first corner, I was in ninth place. I overtook a guy who started out too fast and couldn’t keep his pace, and another one who also couldn’t keep up with the rest. About two miles in, another runner, let’s call him Dr. Evil, came breathing up my neck. I tried to shrug him off, but he slowly inched his way past me. Energized by him, though, I up’d my pace and was now breathing up his neck! He overtook another person in a blue long-sleeve jacket, I followed. Why do you wear long-sleeve in a race?! Eventually I caught up with Dr. Evil, and we ran side-by-side for like half a mile, unable to pull away, unwilling to give in. Things stayed that way until the final stretch when both of us were overtaken by our fashion genius from earlier. Dang it! What’s more, Dr. Evil suddenly unleashed his last reserves, pulled away, and finished 10 seconds ahead of me in fifth place. Losing on the final stretch, I’m sure we’ve all been there. But even more than outpacing our competition, running teaches you a lot about life and mastering challenges. I was disappointed that I wasn’t as fast as Dr. Evil or Calvin Klein, but in the end trying to keep up with them made me run faster and improve my time from last year by 30 seconds. This challenge made me become better. In grad school it’s often easy to be disappointed by comparing ourselves to others. But the key is to recognize our own personal growth instead of being put down because we didn’t finish first. Other people’s victories are not my losses. And my losses don’t mean I’m unfit. Running a marathon is no small thing, but neither is finishing a thesis or getting a job. It requires perseverance and a lot of outside support to achieve either of these. You have to manage your resources to make it to the finish line. Just like a cheering crowd can incite me to keep running when my feet hurt and my muscles are on fire, so can friends and family help us get through hours of tedious number crunching or stressful job interviews. Running my first marathon was a unexpected challenge that I really wasn’t prepared for. But that’s life sometimes. Things can take unexpected turns, be harder and take longer than we anticipate. My dissertation certainly is, and getting into the job market will be, too. But knowing that I’m good at what I’m doing, that I enjoy running and believe in my own abilities, combined with the encouragement of those around me, made me achieve something that I had no idea I was able to do. For the last two years I have been studying decision making in winter wheat farming in the Southern Great Plains. I want to help forecasters provide seasonal climate forecasts for farmers that do a better job of warning farmers of bad conditions, such as drought, extreme rainfall, or heat.
Now, seasonal forecasts are nothing new. The National Weather Service has been issuing them for decades. But farmers don’t use them very much because they are hard to understand and overall don’t contain the sort of information farmers need to make decisions. So all we need are better tailored forecasts and crop failure is a thing of the past? Unfortunately that’s not quite the case. Hailey Wilmer, a Ph.D. graduate from Colorado State University who currently works as a postdoc at the USDA Northern Plains Climate Hub in Ft. Collins, Colorado, and María Fernández-Giménez, a professor at CSU, studied ranchers in Colorado, New Mexico, and Arizona to gain deeper insights into the social dimensions of ranching decisions related to drought. The two researchers found that besides the weather forecast, decisions are often shaped by many factors, for example traditions, personalities, relationships and interaction with fellow ranchers, risk aversion, or financial goals of the individual rancher. Conducting 38 interviews with male and female ranchers, Wilmer and her co-author found four reoccurring patterns of how these social factors affect decisions and adaptive actions to mitigate drought on the ranch. 1. Security over profit Some ranchers, learning from peers and past experiences, prioritized maintaining a financially viable ranch over the long run by not overstocking their ranch in good times and maintaining feed and a minimum number of “seed cattle” even through bad droughts. “If you will stock conservatively when the severe droughts hit you will be able to stay longer and maintain your seed stock to where everyone else has already sold their seed stock or they are all leasing additional pastures somewhere else,” as one New Mexico rancher put it. 2. Facing drought with efficiency To prepare for bad times, some ranchers use good times to build financial buffers that would carry them through droughts. During drought, they reduce the number of cattle or change grazing patterns so that existing grassland vegetation lasts longer. Although these ranchers tried to avoid risk, if they saw other ranchers succeed with a risky decision, they were inclined to try it, too. In times of need ranchers also help out each other, share expertise, or find additional forage. When the quantity of cattle went down, improving their quality was the top priority for most of these ranchers. 3. Diversified income Not all ranchers were ranchers all their lives. Some bought ranches after retiring from another career, knowing it is a great risk. During drought, they relied on a range of income, for example on their pension, and they seem to prefer playing it safe. “I think we’ve decided that we’re going to play defense as far as the climate risk goes, as opposed to try[ing] to maximize stocking or to continue to grow or expand the operation,” explained one rancher. They also plan ahead, for example by using weather and climate data to bump up or reduce stocking rates. “We don’t like to do crisis management. We like to sort of prepare.” 4. Living with the “new normal” The largest group of ranchers, thirteen, seem to have mastered the art of drought management, and was not shy to show it. They boasted experimental approaches to drought management, savvy business management practices, emphasized their successful careers as quality cattle producers and natural resource stewards, all while not relying on consultants or agricultural extension. “Trying something new” and “not being stuck in a rut” were their guiding principles. If drought forces them to reduce their herd, these ranchers, like many of their peers, try to improve quality. “If drought is going to cut me back two hundred calves or three hundred calves, or whatever the number is, I have to make that up with quality.” All this, however, seemed to be essential, as many of these ranchers said living in drought for them is the “new normal”. “Well, we kind of been in a drought ever since we’ve had this place.” These findings show that decisions in the real world are often a lot more complex than we as scientists think. And it is a particular struggle for those of us who work in boundary organizations understand both scientists and users and to help both sides understand each other and facilitate collaborations. “This paper pushed me toward looking at how different groups ‘know what they know’ and how that influences not just management practices, but also how we interact and set goals,” says Wilmer. Despite the limitations of this study — small sample sizes, for example, always make it difficult to generalize results to a larger population — it showed me how diverse and complicated the world of agriculture is, and how little we understand of it. Quantitative or technological approaches are not always enough to make a positive change in agricultural decision-making. If we want to help farmers and ranchers, not only do we need to know how to create better forecasts, but also how important these forecasts are among everything else that plays a role in the real world of farming and ranching. Literature: Hailey Wilmer and María Fernández-Giménez (2015): Rethinking rancher decision-making: a grounded theory of ranching approaches to drought and succession management. The Rangeland Journal, 37, 517-528. Photo: Toni Klemm This article was originally posted on the Early Career Climate Forum in June 2017. We’ve all heard the phrase that science should be explained on the level of sixth- to eighth-graders to be understandable for a general audience, right? But who has ever tried to explain science to actual sixth- to eighth-graders? I can proudly say now I did, and I’ve only suffered minor bruises. A few weeks ago I was invited to a middle school in Norman, Oklahoma, where I live, to talk about climate change. Laura Vaughn, the school’s science teacher, and her social studies colleague had organized a two-hour guided inquiry lecture for their 280 seventh-graders, investigating with little guidance from teachers how climate change affects our lives and what we can do about it. Me and 11 other researchers and city employees had a table each in the school’s gym where we set up demonstrations to show, for example, how CO2 increases air temperature and causes ocean acidification, what tree rings can tell us about the earth’s past climate, and how clogged up stormwater runoffs can increase flood risk. I wanted to explain how climate extremes like drought, flood, or heat impact our agriculture, what climate change does to this, and what farmers can do to maintain a good harvest. Or, I should say, that was my plan. Explaining my work to peers is often hard enough. But talking about it to non-scientists — policy-makers, managers, or the general public — always seems infinitely more difficult for me. To help me become a better science communicator, I recently started a course with Toastmasters International, a non-profit that teaches public speaking and leadership skills. (I blog about my experiences with Toastmasters on my personal blog.) In every meeting, I throw myself into situations that improve my ability to speak clearly and coherently, to spot unnecessary jargon and then avoid it, whether it is a prepared speech or an spontaneous answer during a round of questions. I also participate in discussions with students, talk to people outside my discipline, and of course present my own research to people outside my field. But unlike these situations, Toastmasters feels like a more safe environment to make mistakes. We evaluate each other, comment on grammar, use of fill words, applaud what went well and give suggestions for what didn’t. No one is perfect, and everyone is there to improve. At a geography conference in Boston, I recently learned about the National Science Foundation (NSF) Research Experience for Undergraduates (REU) program. The ten-week long program, which run every summer, funds travel and housing for its participants, many of which applied at an REU program at a different university. The program doesn’t focus on collaborative research or communication per se but is meant to give undergraduate students a general taste of research and let them explore other disciplines, for example for graduate school. That said, some schools do run programs in which interdisciplinary work and communication are very much part of the deal. The REU program at the University of Central Florida, for example, sends student from different fields in groups to coastal communities in Belize to work with locals on environmental problems, like disaster management and ocean waste. Not only do students have to speak Spanish to participate. These supervised projects also train students to be open about their work and to avoid jargon when communicating with the public. A similar approach takes Clark University in Massachusetts with their REU program called HERO (Human-Environment Regional Observatory). Undergraduates study the impact of a tree planting program on wildlife, noise pollution, or air quality through tree surveys and interviews with residents, and present all their findings to the public, improving their own knowledge about human-environmental interaction and qualitative analysis, as well as their communication skills. At the University of Oklahoma (for example at the South Central Climate Science Center), REU students from any discipline can study weather and climate topics, like tornados, severe weather, or societal impacts of weather and climate extremes. Back to our middle school event. With 280 rambunctious students roaming around my station for two hours and throwing questions at me, my brain was constantly in the ropes trying to answer questions like “What part of climate change do you work with?” or “What are some solutions to prevent climate change or even reverse it?” Often I just didn’t know what to say. Not that I didn’t know the answer. I didn’t know how to simplify it enough. To reassure myself I often ended with “Does that make sense?”, upon which one student admitted “Well, not really…” throwing the ball back at me for a second attempt. Convoluted sentences with more than 15 words seemed to confuse students, and most jargon whatsoever threw them off immediately. To buy myself time I often kicked the question back to them: “What do you think how we can reduce climate change?” — which made magic happen! They would suggest reducing pollution, I asked them how we could do that, and together we went from talking about air quality and eating more veggies to biking to school instead of being driven by their parents. It was mentally exhausting but instead of preaching the monologue of bad fossil fuels and polar bears far away, I used their knowledge and focused on solutions they can contribute to. It was mentally exhausting, but what they eventually wrote down were not my answers but theirs. Laura Vaughn, the science teacher, later emailed me to say that some of her students told her my station was their favorite. Two weeks later I got invited again for presentations by the students. Each seventh grade science student designed a poster or powerpoint presentation of their favorite topic, and their social studies colleagues evaluated them. Many used the websites and online databases I had shared with the teacher, and some chose agriculture as their topic. One girl told me irrigation can be both be a blessing for farmers in times of drought but also a curse because it depletes the aquifer if farmers irrigate too much. I was delighted about how much they learned, and I was surprised how much I had learned, too. All photos by Toni Klemm.
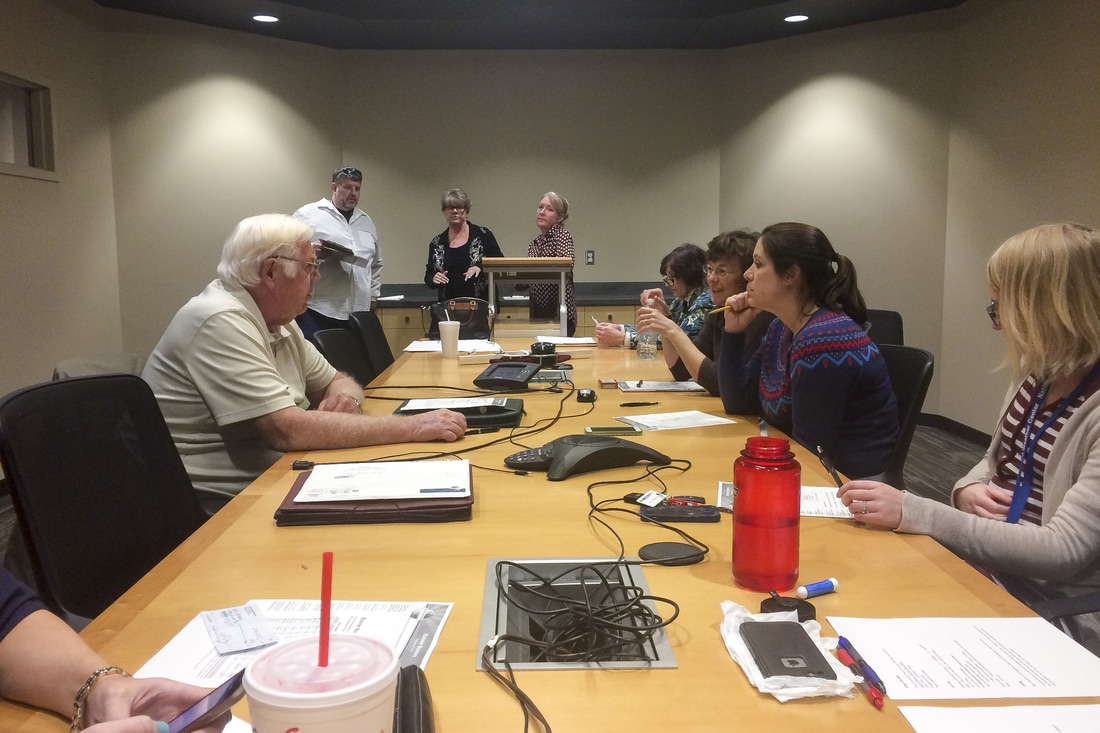 Welcome to part two of the series. My overall goal of being at Toastmasters is to be less nervous about public speaking. And while the study book is great at teaching me all kinds of things that help me be less nervous, there is nothing more effective than to actually doing a speech. You don’t learn to swim if you don’t get in the water. The ice-breaker (which I did several weeks ago, sorry about the delay) is a gentle way to get your feet wet without fearing to drown. It’s the first prepared speech everyone gives, and it’s by no means impossible. My assignment was to introduce myself (in four to six minutes), something we’ve all done over and over, but to create a talk with the basics of any speech: a beginning, body, and ending. The key was to not get carried away in details be selective to create an interesting theme, like unusual jobs during college, places you lived while growing up, or stories about boy- or girlfriends in school if you feel brave. Some dry (self-deprecating) humor also never hurts. And thankfully, notes are totally fine. I drafted my speech somewhere between midnight and 2 am (just like this blog post), read it aloud to my girlfriend to make sure things make sense and I stayed within four and six minutes, got her feedback, and improved over time. I decided to talk about growing up in East Germany (communism always seems like an interesting topic in the U.S.) and what traveling around Europe and the world meant and means for my family and me after the end of the wall. You can read the final version below. I’m happy to report that not only did people enjoy the talk (and asked me lots of questions after the meeting), but I was glad to see my jokes working and people laughing at the right moments. After four minutes and 32 seconds, everyone applauded and I sat down again, happy and relieved. Presenters, me included, often make the mistake of speaking faster or skipping slides when their speaking time runs out. We can never present all the information in as much detail as we would like to. Even if we had all the slides and all the time, our audience would just stop listen. But simple steps like focusing on a few things and keeping a basic structure can help people remember what’s important about my research. And if they found it interesting, maybe they’ll ask me for more. Toastmasters Lesson #1 , Feb 13, 2017 Growing up Behind the Wall I grew up on the third floor of a farm house, surrounded by big trees and lush fields of green on the edge of a small town in East Germany, called Pausa. Making hay, feeding sheep, and walking to school, much of growing up for me and my younger brother meant being outside. My hometown claims to be at the center of the earth, the place that everything else spins around, proudly symbolized by a huge, rotating, stained-glass globe on the roof of our town hall and proven by the earth’s axis sticking out of the ground in the basement underneath it. We even have an organization that takes care of lubrication, the Erdachsendeckelscharnierschmiernippelkommission. (I’m going to make that the word of the day one day!) Being at the center of the entire world, naturally there is adventure lurking in every direction. Sadly, our mode of transportation was far from ideal for long-distance traveling. This Trabant [holding up the Trabant model car] was literally one of two car models in East Germany, and with four people inside it felt about as small as this model. Of course, traveling in East Germany was also limited for another reason. Without formal invitation from a relative or friend “in the West”, there was no way we could get past the Iron Curtain. My mom remembered that every time her parents would take her and one of her three sisters on a vacation to Hungary, my grandma would point to the right as they went through Czechoslovakia and say to my grandpa: “I wish we could go to Austria.” When I was in second grade, someone decided, for reasons that were beyond my little mind, to combine East Germany and West Germany, which I liked because it meant I didn’t have to go to school on Saturdays anymore. With no wall to keep us from traveling (and soon better cars, too), my family started exploring the rest of Europe. Five years later, when I was 12, I had seen Florence, London, and Stockholm and most countries in between, some of them even two or three times. In 1995 — maybe because we ran out of places to see — my parents decided to book plane tickets for all of us across the pond to North America. I had never been inside of an airplane before, so I was very excited. In fact, all of us were, so we kept coming back, and the next few summer vacations were filled with road trips through national parks, gorgeous landscapes, and buzzing cities with skyscrapers and lots of people. We were stunned by the Grand Canyon, which looks even grander when you’re little, we watched Old Faithful in Yellowstone, we drove across the Golden Gate bridge and around the Great Lakes, visited Plymouth Plantation, and saw New York City from the top of the World Trade Center, twice. The second time during a visit in 1999, but the first time we managed do get up there and back to the airport despite only having a three-hour layover at JFK. German precision planning. By the time I graduated from high school, I had visited Canada, Mexico, and 39 out of the 50 US states. Exploring places must be in my family’s DNA. A few years later, before my mom went on a one-year journey across the Asia-Pacific region, my cousin and I hiked through a remote national park in Australia, with 40-pound backpacks and nothing but a small map with a dot that marked a cabin in the woods where we would spend the night. After finding our accommodation, by a pristine lake surrounded by mountains, we spent a night literally in the middle of nowhere, enjoying tranquility after a long day of travel. I eventually studied — no surprise — geography, like my mom did, because I wanted to learn more about this complex world we live on. After seven years in classrooms, though, the travel bug bit me again and I ended up here in Oklahoma, with a lot more geography to study and a lot more places to explore. As I am nearing graduation, I am reminded of the glass globe on our town hall slowly turning and watching the little dot that marks Pausa as it moves around, and being amazed by just how much of our world there is that I haven’t seen yet. 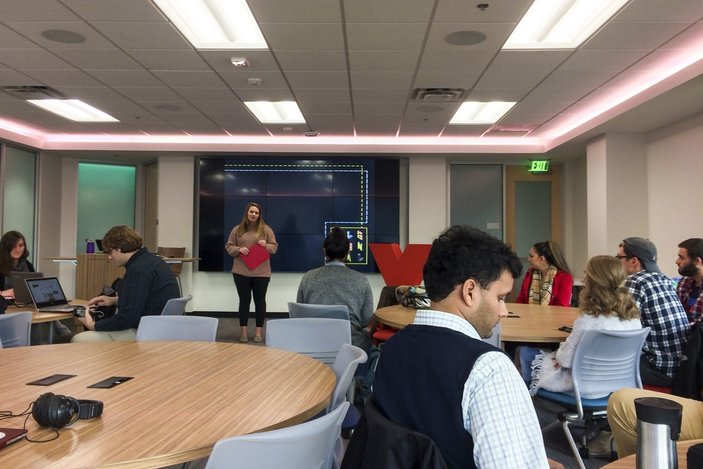 This is the first part of a blog series. If you ever had to speak in front of a large audience or a small group of really important people (like say, your committee), you probably know how tough that can be. Talking coherently, avoiding fill words, and following a storyline or reasoning that people understand — speaking well is hard. I realized how much I had to work on this for myself last December. I had applied to be a student speaker at the University of Oklahoma's annual TEDx conference every January. I’ve been involved with TED for many years behind the scenes, translating subtitles of TED talk from English into German, and doing photography at TEDxOU since I started my Ph.D. in Norman. This was my moment to shine on stage — and I failed big time. Despite planning and preparing for over 6 months, collecting information and developing a storyline, the audition session went anything but smoothly. I stuttered, lost my trail of thoughts, forgot key points of my talk, and even went overtime. Not surprisingly I was not selected as a speaker. What did surprise me, though, was that the selection committee liked my topic, science communication, and I got invited to speak at next year’s TEDxOU as a regular speaker.  All I need to learn until then is how to pull off the perfect TED talk. But being a good speaker helps for more than TED talks. I can become better at presenting my research at conferences, deliver elevator speeches, be more confident in my dissertation defense, or simply get a point across at a party or on the plane. So, in this blog series I will share some of my experiences, lessons learned, and funny stories along the way. In mid-January, I decided to take become a member of Toastmasters International, a non-profit that teaches speaking and leadership skills. I joined a group that two of my coworkers were already part of, at first as a visitor, and after a few weeks as a (paying) member. (Just to be clear, this series is not sponsored or endorsed by Toastmasters. I’m paying my membership fees just like everyone else and don’t get any special treatment for writing about it.) Toastmasters is a bit like school for grown-ups. Our group is a cheerful mix of a dozen or so researchers, business managers, and retirees, and in each of our weekly meetings there are one or two prepared speakers, a round of table topics — themed questions on topics like traveling, Christmas, or gardening that people need to answer on the spot — and the word of the day, selected by a group member for people to incorporate into their speeches. Someone leads the meeting while others carefully evaluate all speakers, keep an eye out for grammatical errors, fill words, if the word of the day was used, by whom, and how many times, and most importantly of all if people went over their allotted time. Or under. The rotating schedule is meticulously planned, to say the least.  A few weeks after becoming a paid member I received my learning materials with ten projects on organizing a speech, choosing the right words, using body language to emphasize, or inspiring my audience. To finish all ten in one year I will need to do about one every month. So much for starters. Here we go. 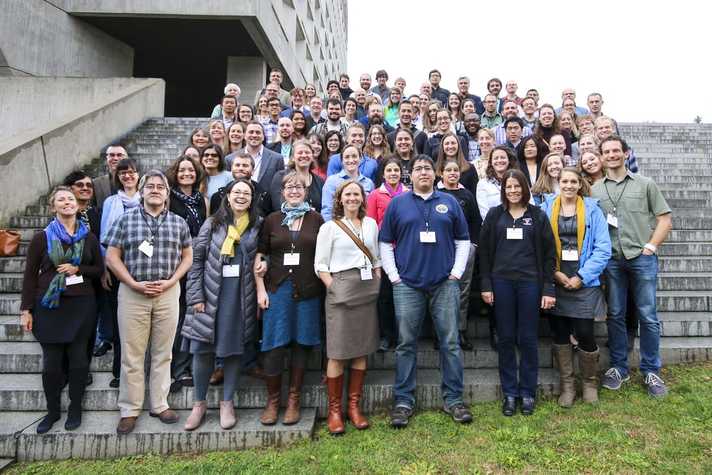 Participants, speakers, and organizers at the Climate Science Center Early Career Training in Amherst, MA Participants, speakers, and organizers at the Climate Science Center Early Career Training in Amherst, MA This article was originally posted on the Early Career Climate Forum in December 2016. On November 2nd and 3rd, the first ever National CSC Early Career Training was held at the University of Massachusetts Amherst. For two days, students from across the U.S. heard about peer reserach ranging from butterflies in North Carolina, paleoclimatology along the Gulf Coast, to the impact of wildfires on wild berries in Alaska, along with so much more. In case you missed it, Andrew Battles wrote a short summary a few weeks ago. But because a picture is worth a thousand words, here is a short video I made showcasing the training to give you more of an inside look and let some of the participants and organizers speak about their experiences and the purpose of the training and of the research conducted at the Climate Science Centers. Enjoy!  (c) Flickr | Oklanica (c) Flickr | Oklanica There is this sketch of a Venn diagram with two non-overlapping circles, one being a person’s comfort zone, and the other one showing “where the magic happens”. A few months ago, my advisor sent me to a conference in Salt Lake City that felt exactly like this Venn diagram. While many of my early career co-workers were at a science communication workshop at Texas Tech University in Lubbock, Texas, I was en route to a joint conference on agricultural and forest meteorology, boundary layer climates, and biogeosciences. The areas might not reflect it as much, but I was way out of my comfort zone. 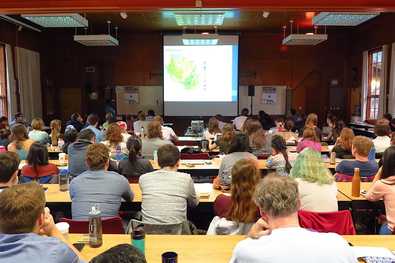 10th Graduate Climate Conference 2016 10th Graduate Climate Conference 2016 And that was not the first time it happened. In October of 2013, I was at the 7th Graduate Climate Conference in Woods Hole, Massachusetts, a fun and relaxed student conference and one of the first conferences I ever talked about my own research idea. The only problem was, that entire sessions were dedicated to super-specific issues, like atmospheric dynamics, ocean biology, or aerosols. The three-day conference had one session on humans, climate, and policy, and a handful of posters about applied research (including my own). That was all. What was I doing at this meteorology nerdfest? (Admittedly, New England in the fall is off the charts beautiful, so at least from a photographic standpoint it was totally worth it!)  What I didn’t understand in 2013 I learned this summer. After five days of talks about field campaigns, flux experiments, and instrument calibration, I understood that this work is not just essential in understanding how our atmosphere works or how plants react to global warming. This research can be the foundation of seasonal climate forecasts that researchers like me use to make decision tools for farmers. As an applied, interdisciplinary researcher, I should be outside my comfort zone. My job is not only to understand what users want and how decision tools that researchers like me try to create are used (or not used). I also need to understand the work of modelers, statisticians, agronomists, or anthropologists, to apply their methods, to better judge which climate models or statistical techniques work best for me, to appreciate their work, or simply to speak their language and understand their way of thinking. Afterall, I might be using their work for my research, or even more so be there future collaborator.  This weekend, I am again at the 10th Graduate Climate Conference, this time in Washington state, presenting (again for one of the first times) results from my research. But between log cabins and cedar trees, this feels like a lesson-learned check. I’m still struggling to make sense of concepts, acronyms, and jargon, but not as much as I used to. My comfort zone became a little bigger. And as I’m listening I realize that these brilliant, creative, engaging, fascinating minds not only shape tomorrow’s climate research. They might also be the people I’ll be working with sooner or later. Check out: www.graduateclimateconference.com  Screenshot Screenshot This post was originally written for the Early Career Climate Forum and posted in August 2016. Earlier this year, I wrote an ECCF blog about a fall semester undergraduate class at the University of Oklahoma (OU) that taught students about climate science, the impacts of climate change, and that gave them a look behind the scenes of the climate negotiations at the Paris COP21 meeting last December. Well, I’m happy to report that this fall this class is back — and it’s gotten even better. Starting August 17th, the South Central Climate Science Center (SCCSC) will be offering “Managing for a Changing Climate”, an interactive class based on the experiences and feedback from last fall. “Participants will hear from a wide variety of experts from both the research and management worlds”, says Aparna Bamzai, University Assistant Director at the SCCSC and coordinator of the course. They will teach lessons about the components of the climate system, including the range of natural climate variability and external drivers of climate change, in addition to impacts of a changing climate on sectors such as the economy, policy, ecosystems, and indigenous populations.  (c) Toni Klemm (c) Toni Klemm The best part: this year the class will be available not just to OU students but also — for free, thanks to funding from USGS and NASA — to natural resource managers, tribal environmental professionals, and anyone else who is interested in the science and impacts of climate change, because almost everything will take place online, on OU’s interactive learning platform Janux. Professionally produced videos will feature experts from across the south-central U.S., and participants will conduct readings and discussions on the online course page. All participants will be evaluated through online quizzes, while university students enrolled for credit will also produce individual term papers and — similar to the class last fall — a group project culminating in a mock negotiation of the United Nations Framework Convention on Climate Change.  (c) Toni Klemm (c) Toni Klemm To produce the class videos, the SCCSC teamed up with Next Thought, a company that specializes in online education and produces all of OU's online classes. On the course website, videos and other online content will be released successively as the semester progresses instead of all at once. That way class and online participants can engage in discussions about the same course material. The class is open to enroll at janux.ou.edu. I will participate as one of the online students. I’m excited about this class, because it will bridge the gap between different fields: science, management, and policy-making. If you plan to enroll in the class and what to share your experience in a guest blog post during or after the semester, please let us know via email at [email protected] or through Facebook or Twitter.
Development of this course was funded by the USGS through the South Central Climate Science Center on Grant #G15AP00136, NASA through the Oklahoma Space Grant Consortium on Grant #NNX11AB54H, and the University of Oklahoma College of Atmospheric and Geographic Sciences. The contents of this course are solely the responsibility of the authors and do not necessarily represent the views of the funding agencies. This post was originally written for the Early Career Climate Forum and posted in May 2016.
I recently finished an online survey of agricultural advisors in Texas, Oklahoma, Kansas, and Colorado about seasonal forecasting for winter wheat farmers. Online surveys are everywhere these days, and with free tools like SurveyMonkey or Google Forms, anyone can conduct a survey. Preparing and conducting a survey for research, however, is no small endeavor and requires careful consideration. My survey, for example, took 3 months to plan and another 3 to conduct. Here are 6 tips on how to get the most out of your efforts. 1. Survey or something else? Ask yourself: What information am I interested in, and is a survey the best method to get that information? Surveys work well with quantitative information that can be ranked, listed, counted, or compared on like-dislike scales. But surveys are not good for qualitative research, like descriptions of events, detailed anecdotes, or open-ended conversations. For this kind of information, personal interviews are a better tool. Analyzing interviews – conducting, recording, transcribing, and analyzing text – is also much more labor-intensive–one reason why interview studies generally have fewer participants than survey-based studies. The pros and cons of qualitative approaches are nicely laid out in Berg (2008, full references at the end of this post), a seminal book on qualitative methods. Babbie (2014) provides the basics about survey research (chapter 9) and quantitative analysis (chapter 14). Also, discuss your approach with faculty, experienced coworkers, and your committee. I decided that a survey followed by a small number of interviews would give me the best of both worlds – a large, quantitative dataset to analyze and detailed information to explain some of the most interesting survey results, all while being time-efficient. 2. Survey methods You’ve established that a survey is your method of choice. But which survey method should you choose? Many surveys today are conducted online as opposed to via phone or snail mail, and for obvious reasons: Online surveys are easy to disseminate – via email or social media – and they are cheap or free to produce (try Google Forms or SurveyMonkey). Online surveys also deliver instant results in a digital format, reducing errors from digitizing mail responses. They also have lower labor costs than phone surveys while having higher response rates: about 25% for online surveys versus 8 to 12% for phone surveys, according to FluidSurveys. Online surveys, as convenient as they are, can create biases. Your target population might not all have internet and/or social media access, or you might not have a complete email list. These biases could lower the explanatory power and generalizability of the survey results. Biases can’t always be avoided, or avoiding them could increase costs. In any case, these limitations should at least be mentioned in the publication. My survey, too, faced the problem of internet bias, but instead of changing my method I decided to change the survey population. Instead of surveying farmers, a group that doesn't use computer and internet much, I surveyed corporate extension agents, agricultural advisors with desk jobs, internet access, and publicly available email addresses. They are also in contact with many farmers in their county, and thus can, to a good degree, speak for them. I couldn’t ask them quite the same questions that I would have asked farmers, but that was a compromise I was willing to make. 3. Survey Design Ask yourself again: What am I interested in? This should help you decide what question formats are best: matrices, multiple choice, open-ended text boxes, Likert scales, images and sketches …? Text books can give you some direction, but think critically about what you read in papers. Was that really the best way to answer the research question in that particular case, or was it just convenient? Could I do it differently and get better, more robust results? Discuss your ideas with your committee or peer researchers. My survey was modeled after focus group and interview research of corn farmers in the Midwestern U.S., which I adapted to fit my time budget and to answer my research questions. Surveying also means explaining differences in responses and, often, trying to confirm or reject a hypothesis. Why did some participants answer in this or that way? Because of their income, their level of education, their geographic location — whatever it is, make sure you ask about it in your survey in order to later cross-tabulate answers and analyze them for significant differences. Also, think about the order of your questions and if you really need to ask all of them. People might be okay spending 10 or 15 minutes on your survey, but too many questions will make them frustrated and tired. Keep it succinct, but still ask everything you need. Let people know at the beginning how long the survey will take (pretests can help you estimate that) and include a progress bar if you can. 4. Question Language By now you probably see that developing a survey takes some time. After weighing the pros and cons of the question format, phrasing, testing, and refining your questions can take weeks or even months. Which words should you avoid? The farming community in the Southern Great Plains, for example, don’t like terms like “sustainability” (which many associate with more government regulations) or “climate change”, for obvious reasons, so I tried to avoid them. Jargon is okay to use, but make sure people understand what you mean. Consult experts to fine-tune the wording. Make sure questions are unambiguous, easy to understand, and check that answer choices cover every possibility. Again, pretesting can reveal most of these issues before you release your survey. The easier you make it for your participants, the more likely they will finish your survey. 5. IRB Approval Getting your survey approved by your Institutional Review Board (IRB, also called Independent Ethics Committee, IEC) is required for all research on human subjects (meaning survey, medical, psychological, and other research on humans) that is intended for publication. You can read more about the IRB here, but in general, the IRB’s job is to make sure you treat your participants fairly, protect their information, and don’t harm the reputation of your university. The University of Oklahoma produced a series of short videos to explain the IRB approval process. Expedited IRB approval for low-risk studies, like in my case with the agricultural advisors, can take be dealt with in one week. If your survey population includes children, prisoners, or pregnant women (so-called “vulnerable populations”), a full panel review is necessary, which can take months, and reviewers might ask you to explain and justify just about every detail in your survey. Some studies need approval by multiple IRBs, for example studies of Native American tribes, which may have their own IRB process. Last but not least, make sure your survey is finalized when submitted for IRB approval. Even small changes, for example in the wording of questions, have to get approved again. 6. Distributing your online survey Congrats! Your survey got IRB-approved and is ready to go. Now to getting your survey out there. Depending on your target population, this can be a challenge for several reasons. For my survey of agricultural advisors, for example, I couldn’t spread it via Facebook or Twitter. I wouldn’t know who took the survey, nor would it be the best way to access my target population. My results would become meaningless. In my case, personal email and email lists were the only method that made sense. There are several ways to increase the number of responses. Connect with your survey population by attending their meetings and introducing yourself. Reach out to trade publications and ask if they would report about your research and the survey you are conducting in their circulation area. When they do, you can link them in your survey invitation. My research was reported by the Kansas Farm Bureau and the Texas Farm Bureau, which I mentioned in survey reminder emails. Especially for out-of-state surveys, this can create trust among the people who are otherwise unfamiliar with you. “Local champions,” people well known and respected by your target group, can also help you boost your response rate. I asked state and regional extension directors to send out invites and reminders on my behalf. Their name in people’s inbox (as opposed to my) most likely made people more likely to take time out of their busy schedule and take my survey. One time I sent out reminders myself. I got zero responses. But local champions are busy people, too. Provide them with email templates, a list of email addresses (semicolon-separated, so they can be copy-pasted into an email address field), and a PDF with information about your research they can attach. Also, ask them to copy you in their email. That way you know the email was actually sent out and when. Collaborating with local champions will be additional work for you, but it is worth the effort. Without them I would not have gotten the response rate that I got. After three months of surveying and several rounds of emails, it was at just over 40%. And as a nice side effect, I had several people say they were very interested in presenting my results. Lastly, timing is critical. Think about times when people are easier to get a hold of. Winter wheat advisors have a lower workload during in the cold months of the year, before temperatures increase in spring and farm work picks up again, which leaves more time for them to do my survey around winter and early spring. Related Material: Babbie, E. R. (2014). The Basics of Social Research (Vol. 6). (especially chapters 9 and 14) Berg, B. (1998). Qualitative Research Methods for the Social Sciences. Third Edition. Edit (August 2017): Pew Research published a comprehensive guide to designing public opinion surveys: http://www.pewresearch.org/methodology/u-s-survey-research/questionnaire-design/  (c) cop21.gouv.fr (c) cop21.gouv.fr This post was originally written for the Early Career Climate Forum and posted in February 2016. Climate negotiations, like last December in Paris, are complex, complicated, and not always fruitful. Last year, an innovative class for undergraduates at the University of Oklahoma gave students hands-on experience of how climate policy is made. This fall the class will go online for everyone around the world to participate. Here is my interview with the instructor and students of this class to summarize their experience with context to the recent Conference of the Parties (COP21) negotiations. Last December, 195 countries came together at the climate negotiations in Paris to shape a policy agreement on greenhouse gas emissions reduction to keep the global temperature rise below 2ºC. Now imagine this: young men and women armed with laptop and paper full of notes and scribbles, arguing about renewable energies, emission reductions, and carbon taxes across tables with signs that say “Egypt”, “Australia”, “China”, or “Tuvalu”. What sounds like one of the sessions in Paris was actually a classroom setting, the highlight of an undergraduate geography class at the University of Oklahoma (OU) called “Managing for a Changing Climate”. The class, co-taught by staff and researchers of the South Central Climate Science Center (SC CSC) and faculty at OU, featured an interdisciplinary mix of human and physical geography, climate science, climate policy, and economics. Dr. Renee McPherson (one of the instructors of the course) explained that one of the goals of the class was to get the undergraduates more familiar with how climate policy is made, and why sometimes there is an agreement, like last December in Paris, and why sometimes there isn’t, like in 2014 in Lima (where last year’s climate conference was held). McPherson is the University co-director of the SC CSC and an Associate Professor in Geography at OU. She attended both the Paris conference last year and its predecessor in Lima (2014) as an observer. “Policy isn’t this quantitative process, that if you go through step one, step two, step three, you’re always going to get an agreement at the end.” 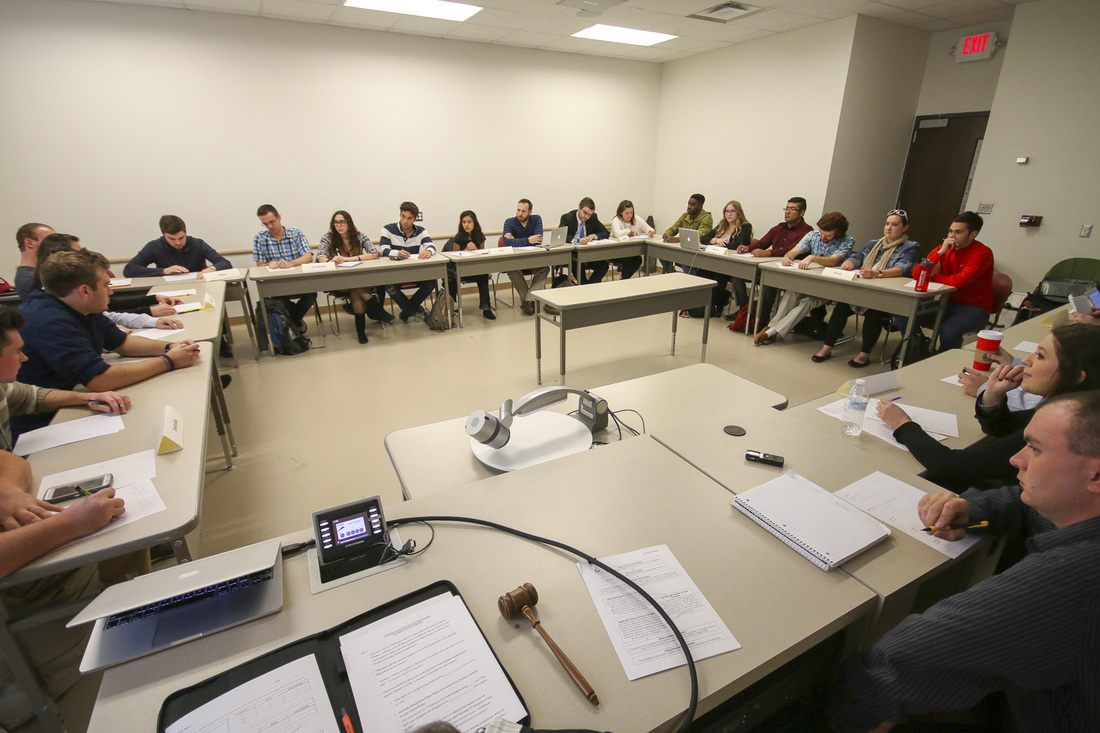 (c) Toni Klemm (c) Toni Klemm Leading up to its own (mock) conference, the class focused on hands-on experience in climate policy, but also featured traditional lectures on economics and climate science. In addition to lectures, students were assigned into teams to represent one of ten countries. Students researched the culture and background of their country to determine which one of the three prescribed policies – renewables, lower emissions, or carbon taxes – to advocate for and defend in a mock climate conference at the end of the semester. “The science has gotten better over the years, and more and more policy leaders are convinced by the science,” says McPherson. Indeed, last year’s negotiations were not so much about whether the climate science was real but what to do about global warming, how to work the problem, said Reid Detchon, Vice President for Energy and Climate Strategy at the United Nations Foundation, in a recent Climate Voices webinar. 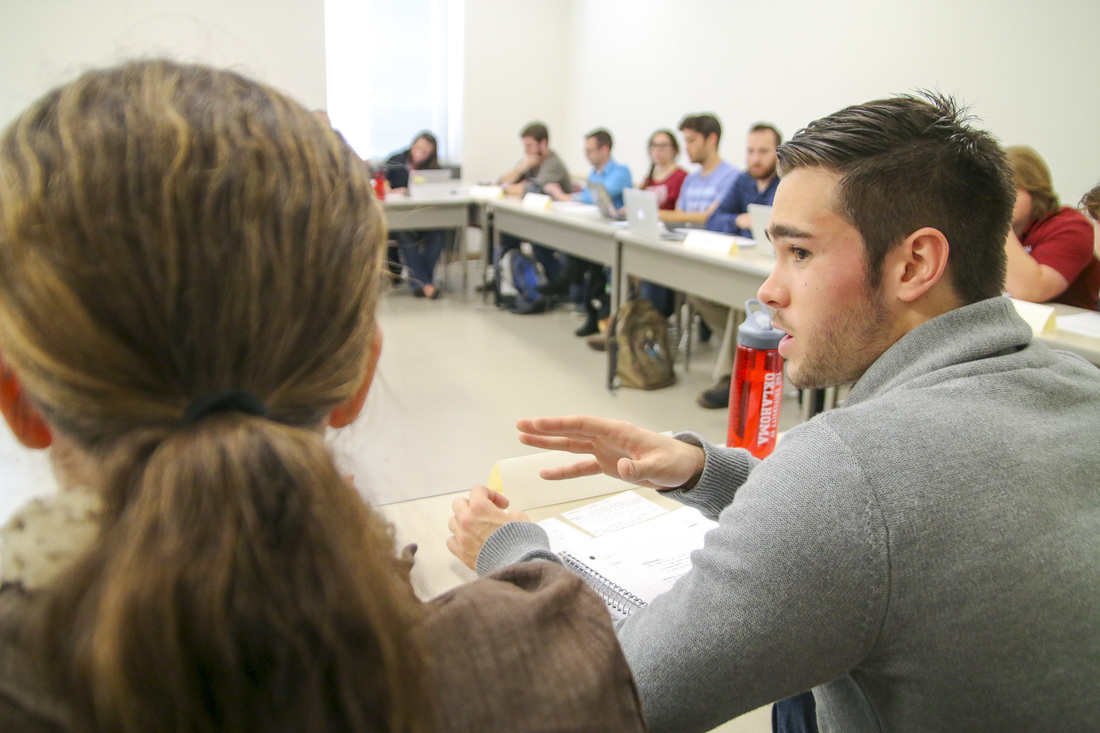 At the end of the semester each of the 10 countries makes a pledge about their contributions… Photo: Toni Klemm At the end of the semester each of the 10 countries makes a pledge about their contributions… Photo: Toni Klemm For Cameron Conyers, a junior majoring in Environmental Sustainability, the mock negotiations made it a “top-notch class”. Teams didn’t just establish their own position, but also considered everyone else’s strategy in order to form stronger alliances. “No one wanted to be the loser”, he remembers. “We looked at targets of each of the other countries, met with their representatives, even outside of class, and hashed out side agreements to pull them onto our side.” At the end of tough negotiations, 9 out of the 10 countries voted for investing in renewable energies, and one voted for carbon taxes. 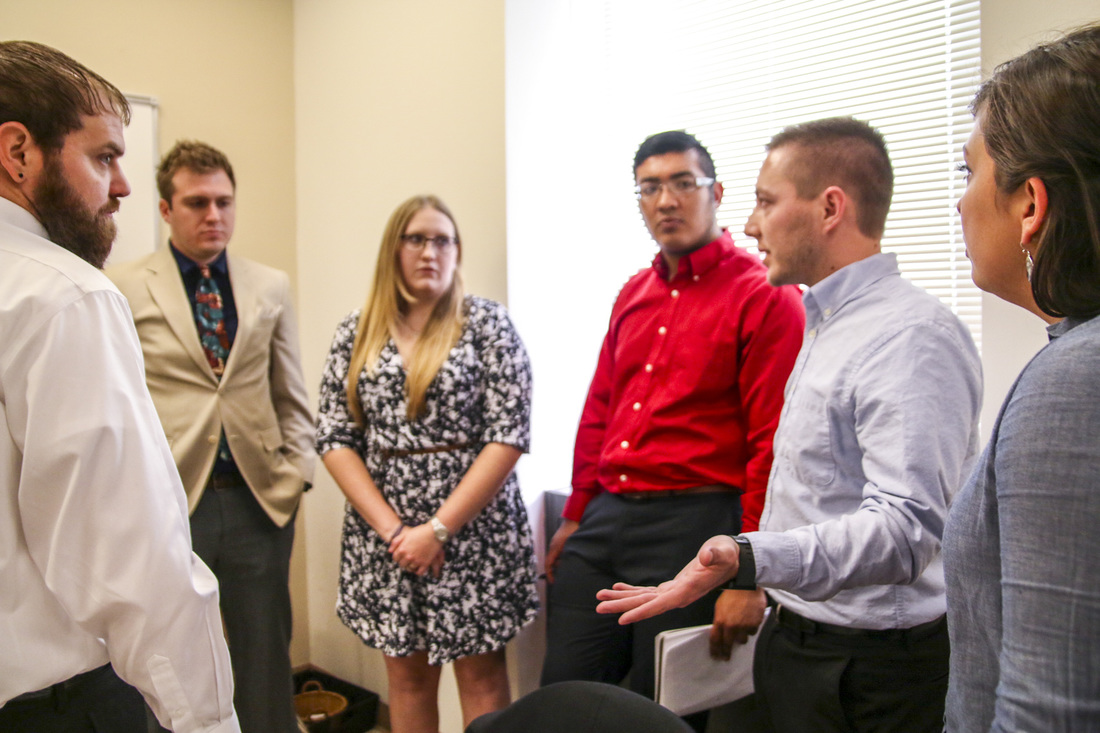 … followed by feisty negotiations about alliances. Junior undergraduate Cameron Conyers (second from the right) and his team, representing Egypt, talk with representatives of the U.S. (center). Photo: Toni Klemm … followed by feisty negotiations about alliances. Junior undergraduate Cameron Conyers (second from the right) and his team, representing Egypt, talk with representatives of the U.S. (center). Photo: Toni Klemm Back to the real world of policy-making, the class finished with a review of the conference in Paris by two of the instructors. Dr. Berrien Moore, Professor in Meteorology and also Dean of the College of Atmospheric and Geographic Sciences at OU, gave a summary of the progress. Dr. McPherson joined via Skype live from the Conference of the Parties (COP21) negotiations to give a feel for the vibe at the meeting, which was overshadowed by the terrorist attacks that had France still in shock. “Any time that a delegate from a different nation came up and spoke, they always prefaced it by some comment [about the terror attacks], like their heartfelt feelings for the people of Paris and the nation of France,” McPherson remembers. In her opinion, the Paris attacks played an important role in the success of the conference. “There was almost a sense that a lot of the nations wanted Paris to have an opportunity to, you know, rise on the pedestal.” 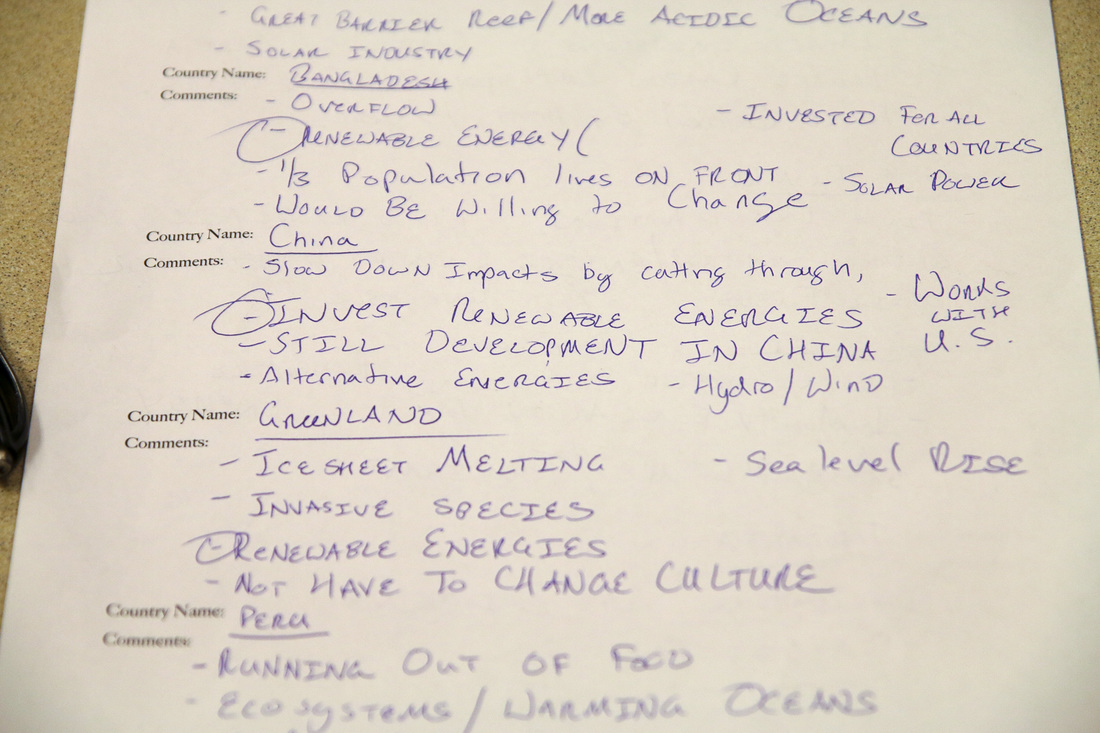 (c) Toni Klemm (c) Toni Klemm “Managing for a Changing Climate” will be offered again as a Massive Open Online Course (MOOC) this coming fall semester at the University of Oklahoma. To receive college credit, students need to be enrolled as OU students, but anyone with internet access who is interested can participate for free (though without getting credit). Follow janux.ou.edu and the South Central Climate Science Center on Facebook and Twitter for updates. The class instructors presented this course at the 2016 annual meeting of the American Meteorological Society. Download their poster here. The course was made possibly by the generosity and collaborative spirit of the OU College of Atmospheric and Geographic Sciences, the Oklahoma Space Grant Consortium (supported by NASA), and the South Central Climate Science Center (supported by the USGS).  (c) Toni Klemm (c) Toni Klemm This post was originally written for the Early Career Climate Forum and posted in November 2015. Three weeks ago I passed my general exams (aka comprehensive exams or preliminary exams). It’s something Ph.D. students must go through before advancing to becoming a Ph.D. candidate. It's a test of their knowledge, but passing requires more than just knowing stuff. In my department at The University of Oklahoma, general exams are the transition point from classwork to doing research. The exam committee tests whether the candidate knows the state of the science in all areas related to their research, and it’s for the student to prove they are ready to conduct independent research. Like most generals, mine were divided into a written and an oral portion, although the particulars can vary depending on committee, discipline, and university. My generals consisted of five essay exams on five consecutive days. Each day, I had to answer three to six questions from each of my five committee members within 8 to 12 hours, followed by one, 2-hour session of follow-up Q&A and discussion with all of my committee members at once. 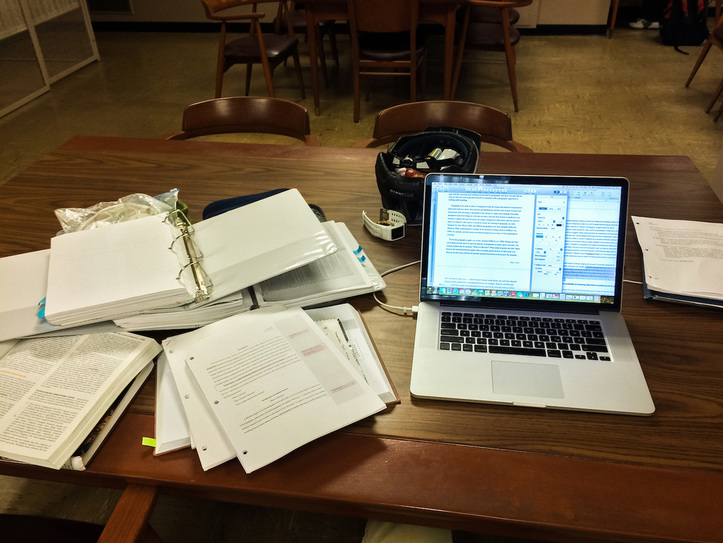 (c) Toni Klemm (c) Toni Klemm The key to making it through the generals is planning, persistence, and strong nerves – and a chunk of good luck. About 6 months ago, in early May, I presented my preliminary research idea to my committee and met with each member to sketch out topics to study for, things they thought would be good for me to know given my research focus. This gave me focus areas and goals to study for, which otherwise would have been hard given that my dissertation spans the fields of social sciences, meteorology, and agriculture. So, how did it go? The short answer is, it was a nightmare and mental torture beyond anything I had ever experienced before. But I passed, so I probably shouldn’t complain too much. But the task I faced each day of the exam was massive, and 8 (or 12) hours were over before I knew it. So good organization was key. Thankfully, my exam was “open book” (as opposed to closed book), so I could use all my handwritten notes from six months of studying along with other sources. However, handwritten notes were probably not the smartest choice, since text files are more easily searchable for keywords and topics. Luckily though, I use referencing software like EndNote, BibTex, or ProCite, to manage hundreds of journal papers, reports, book chapters, websites, and personal communication; each with entries containing abstracts, notes, cross-references, URLs, and of course the publication as a PDF file, catalogued in virtual folders and tagged with meaningful keywords. For a question about climate predictability or forecast skill assessments I had a folder of references. For a question on the economic value of seasonal climate forecasts, I had a folder for that too.  (c) Toni Klemm (c) Toni Klemm The written portion of my exam was a rollercoaster ride of joy and despair. I felt confident giving a good answer and even enjoyed some of the questions. But I was under massive time constrains, and at the end of every day, my brain was exhausted from the brutal workout and capable of handling no more than making dinner and preparing lunch for the next day. I might have looked calm, but inside I was under immense stress. But then I should be. Generals are to test what you’re capable of. You’re a rookie in a boxing match taking on five professionals at the same time. Your goal shouldn’t be to win or to impress anyone, but to not get knocked out. Knowing that, I’m sure no one on my committee expected me to ace the generals, and realizing that helped me keep my expectations realistic and stay positive. By the way, I tried to not see my committee as this group of people set out to give me an unnecessary hard time, but as a team of experts giving their time helping me to succeed with my research idea, advancing science – and, oh, maybe getting a job later on. If, somehow, the written part of the exams doesn’t stress you out enough, the oral part sure will. My committee was given one week to go over my written answers before the oral test. This meant I too, had one week to go over my five essays, to find weak spots, parts I explained poorly or was too vague on, or didn’t reference well. All of this was to try and anticipate what my committee would hone in on with more detailed questions. I identified plenty of weak spots, and quickly realized that whatever I did, I still had huge knowledge gaps, despite the five months of studying before the exams. From plant physiology and climate predictability factors, to map projections and the role of place in communicating and mediating information, to comparing single climate models and model ensembles. It’s easy to send someone out on thin ice with just one discipline, let alone multiple. I’m usually comfortable with public speaking, but during the oral exam I was so nervous that I could barely phrase a full sentence, or even remember the question. To my advantage, all questions were follow-ups from my written exam, so at least I didn’t fall over any new tripwires. Still, I was struggling not to stress out. After some 90 minutes of mental drudgery, I was asked to wait outside for my committee to discuss the final result. A colleague had warned me that no matter how much I know, there will come a point at which I won’t know the answers anymore; admitting this isn’t failure, but more or less part of the process. Still, as I sat there waiting I felt awful, and I honestly didn’t expect them to let me pass. It was impossible to gauge whether my answers had been good enough. I reflected - in a search for words (and self-confidence) I had asked each committee member to repeat almost every question. Most of my answers had been stammered syllables, not sentences. While I waited outside I mentally prepared (or hoped?) for a final question that I could answer really well. Seven or eight minutes later –– sooner than I expected –– the door opened I was asked back in. I expected a long explanation for their decision, followed by a final, deciding question, and the verdict. Something else happened. Before I fully scanned the room, my advisor stretched her arm out and congratulated me. The rest of my committee applauded! I was so baffled I actually asked her if this meant I passed. It did. I did great, she told me. No one ever thinks their orals go well. It took me a few days to appreciate and fully realize what had just happened. There was no sudden relief, exhaling, falling back into an armchair and enjoying the rest of the week. I had to finalize my research proposal, continue developing a survey, and start preparing for upcoming conferences. One job done, on to the next one – I feel like this will be the new normal from now on. But I successfully completed a huge career hurdle and that sure is something. 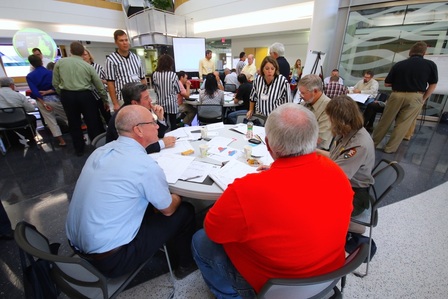 (c) Toni Klemm (c) Toni Klemm This post was originally written for the Early Career Climate Forum and posted in September 2015. Before doctoral students can embark on their research journey they have to pass a general exam, a one-week torture chamber to prove they know all about the methods and fields of science they will touch upon in their upcoming research. My research at the South Central Climate Science Center covers agriculture, climate modeling, statistics, GIS, and social science, so there’s lots to learn, and some of these fields don’t overlap a lot in their methods or language, to say the least. I’m developing tailored seasonal climate forecasts for agricultural producers in Oklahoma. Interdisciplinary research can be messy, stressful, confusing, and very time-consuming—maybe one reason why it is not for everyone. I find it fascinating, though, for exactly these reasons. Conducting, facilitating and funding interdisciplinary research with scientists and stakeholders is one of the main purposes of the Climate Science Centers. One challenge with applied, interdisciplinary problems is actually solving them, providing solutions that people are happy with. Solving these sorts of problems involves getting diverse stakeholders to sit together at a table and understand each other’s perspectives, work together, learn from each other, and come out with practical solutions. This isn’t easy, as witnessed by the challenges involved in matching stakeholders’ needs with the sorts of products and insight researchers can provide, like the seasonal climate forecasts issued by the Climate Prediction Center (CPC). Many farmers and ranchers say these forecasts are unreliable, difficult to read, and don’t give them the information they need to make important decisions. They were developed in what some researchers call the “loading-dock approach”: putting information out on the loading dock, walking back inside, and waiting for people to pick it up and use it. How do we improve on the loading-dock approach? One alternative is what social scientists call adaptive co-management, a combination of two techniques many people are already familiar with: co-management and adaptive management. Co-management describes the collaboration of different stakeholders whereas adaptive management describes flexible, adaptable procedures that incorporate feedback and can change over time through so-called dual-loop learning—basically learning by doing. Adaptive co-management, then, is decision-making among multiple stakeholders with trust, respect, and equal influence who acknowledge that any one result or solution is not the be-all and end-all to the problem but may need to change over time. Changes in farm management, new regulations, shifts in commodity prices, or advances in climate research (such as higher resolution climate models) can force all decision-makers to adapt to new conditions. Sounds like a great idea, doesn’t it? Unfortunately, various obstacles can prevent stakeholders from developing solutions, even when they use adaptive co-management strategies. Common stumbling blocks include preconceived attitudes about other stakeholders (often a result of unresolved conflicts from the past), unwillingness to share influence and power, inability to commit financial or human capital, or simply not understanding each others’ culture and language, literally and figuratively. This last one is a problem that often occurs when “western” scientists work with local experts in developing countries. Institutional mechanisms like meetings, translation, collaboration, and mediation can help develop solutions and products that all participants will eventually use, though none of these is a panacea. Despite these obstacles, adaptive co-management strategies are already being successfully applied. The collaboration between the South Central Climate Science Center and the Great Plains Landscape Conservation Cooperative in restoring native grasslands, which Jessica wrote about last week, is one good example. So are NOAA’s Regional Integrated Sciences and Assessment (RISA) teams, such as GLISA around the Great Lakes, SCIPP in the south-central US, or CLIMAS in Arizona, New Mexico, and northwestern Mexico. While the Climate Science Centers are more involved in climate science integration into adaptation and protection of natural and cultural resources, RISA teams work with a range of sectors, including public health, on climate risk management. The USDA Regional Climate Hubs help farmers, ranchers, and forest owners to adapt to climate variability and change. Internationally, the International Research Institute for Climate and Society (IRI), based at New York’s Columbia University, works with stakeholders in developing countries on strategies to transfer climate science into risk assessment and mitigation. Related material: Cash et al. (2006): Countering the Loading-Dock Approach to Linking Science and Decision Making: Comparative Analysis of El Niño/Southern Oscillation (ENSO) Forecasting Systems. Science, Technology & Human Values 31, p. 465-494. Plummer & Armitage (2007): Charting the New Territory of Adaptive Co-management: A Delphi Study. Ecology and Society 12, article 10. |


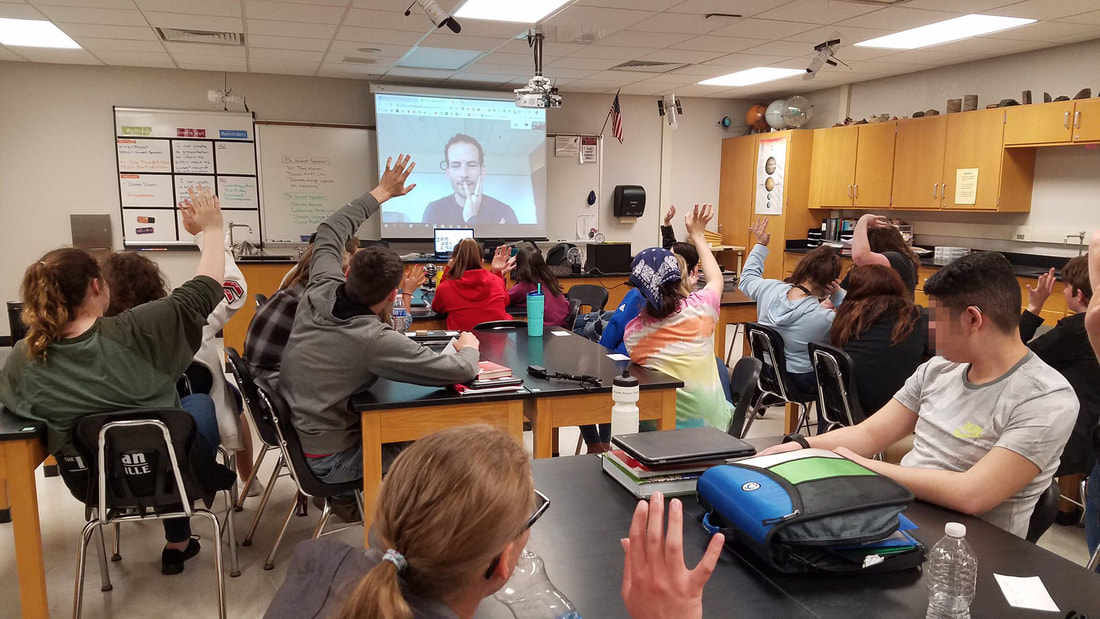
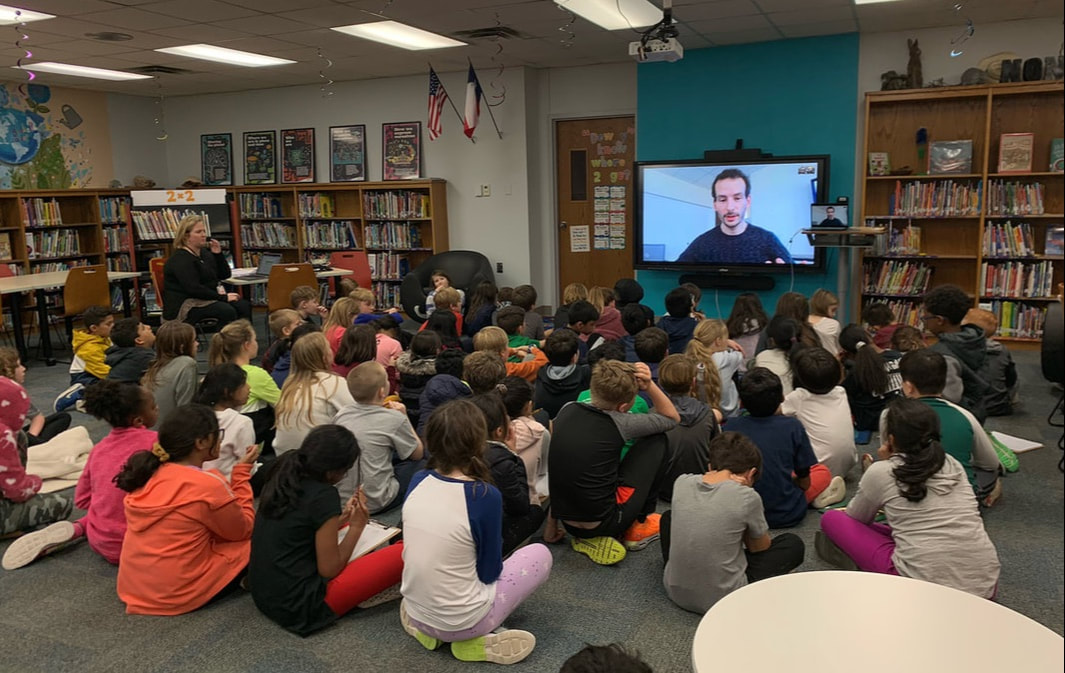
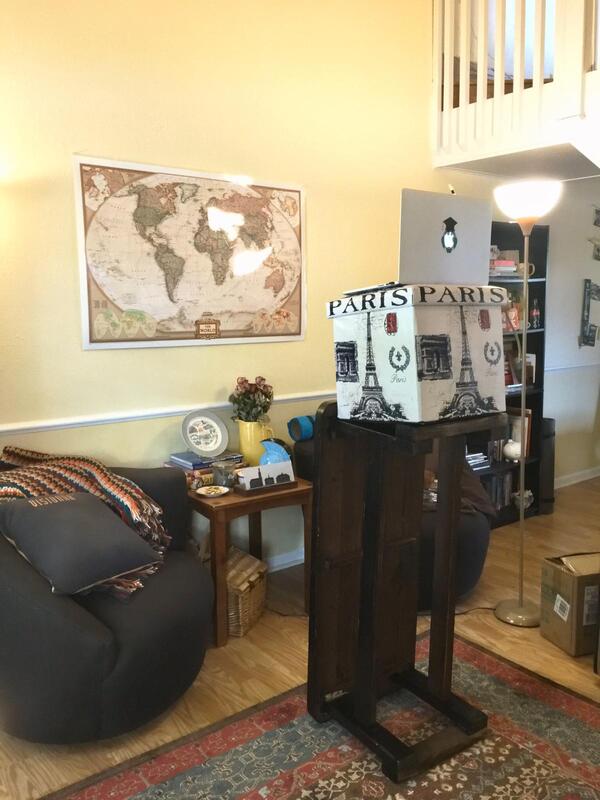
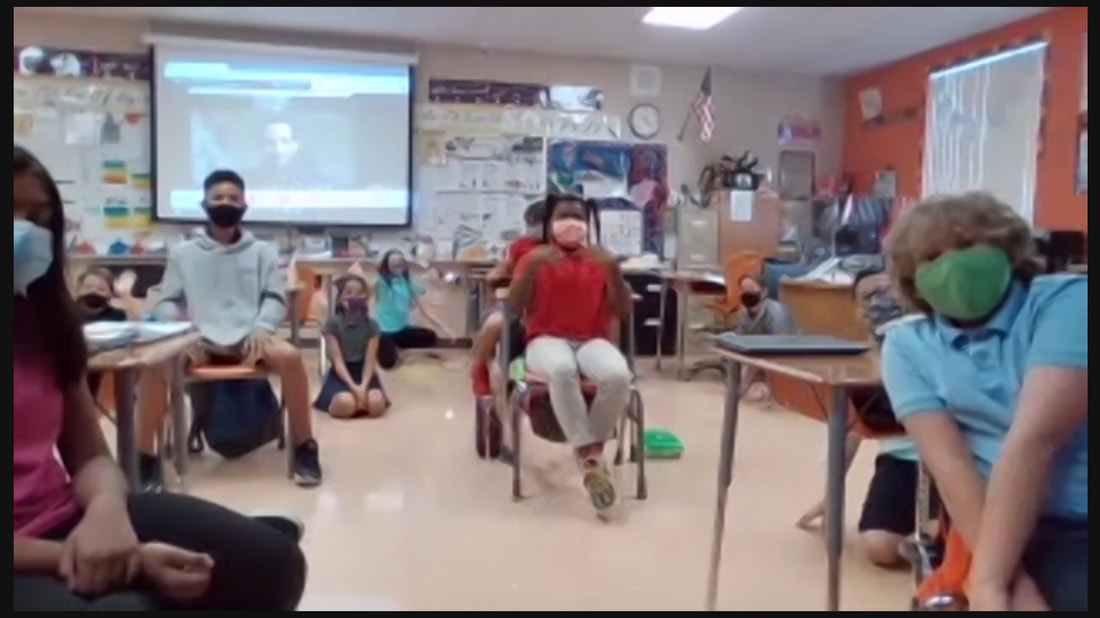
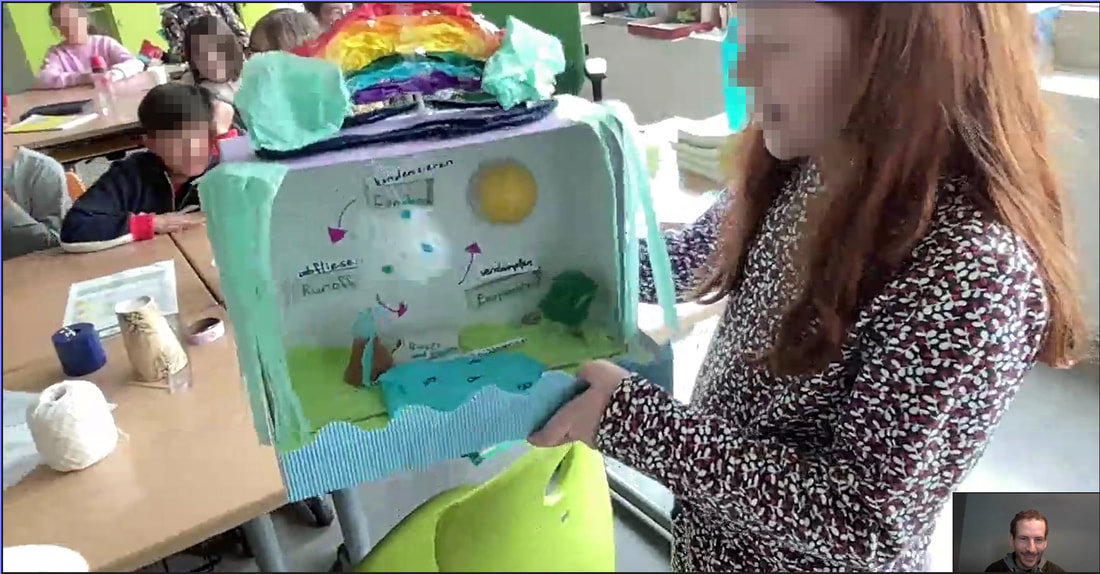
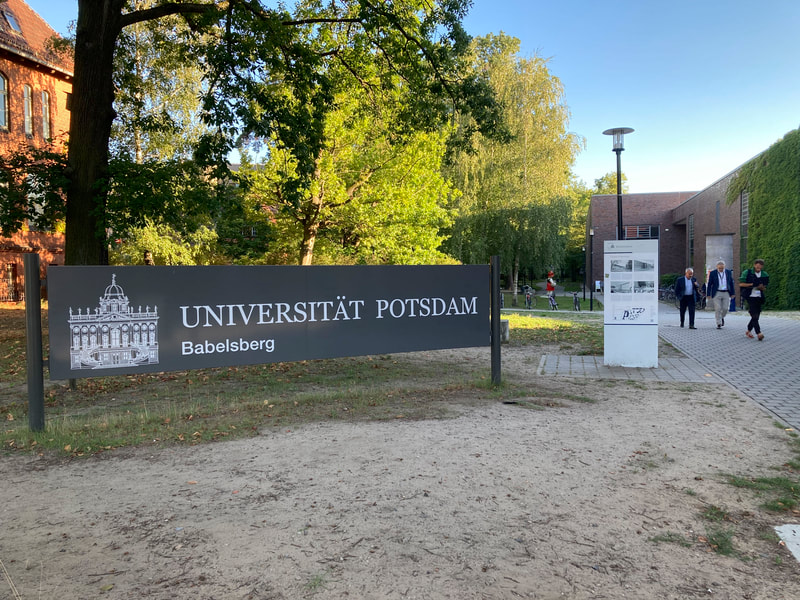
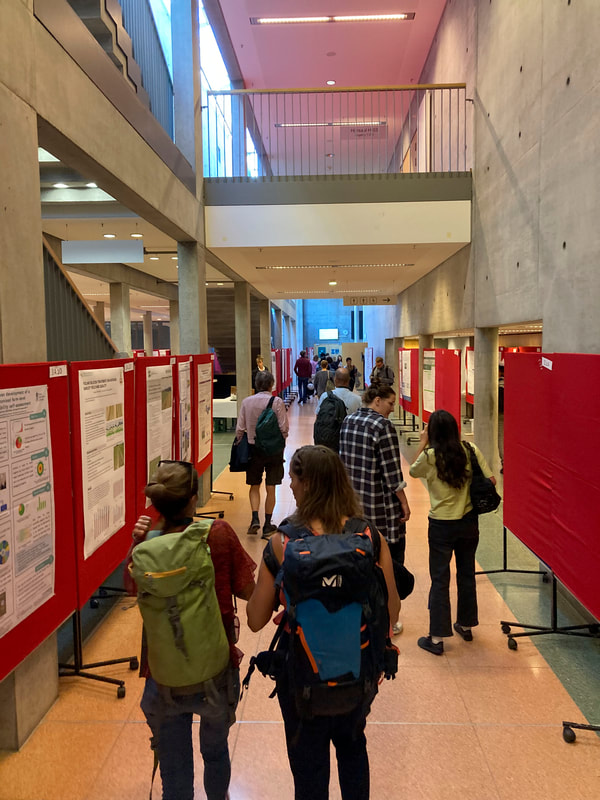
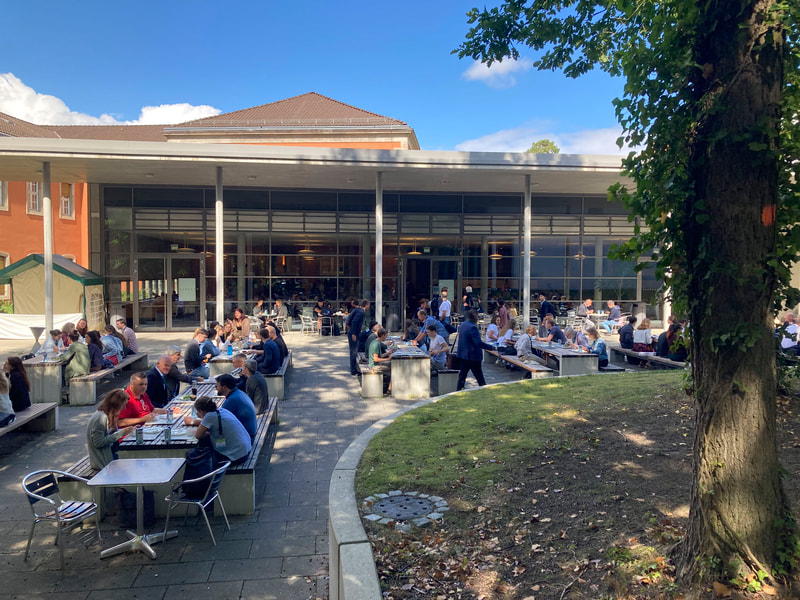


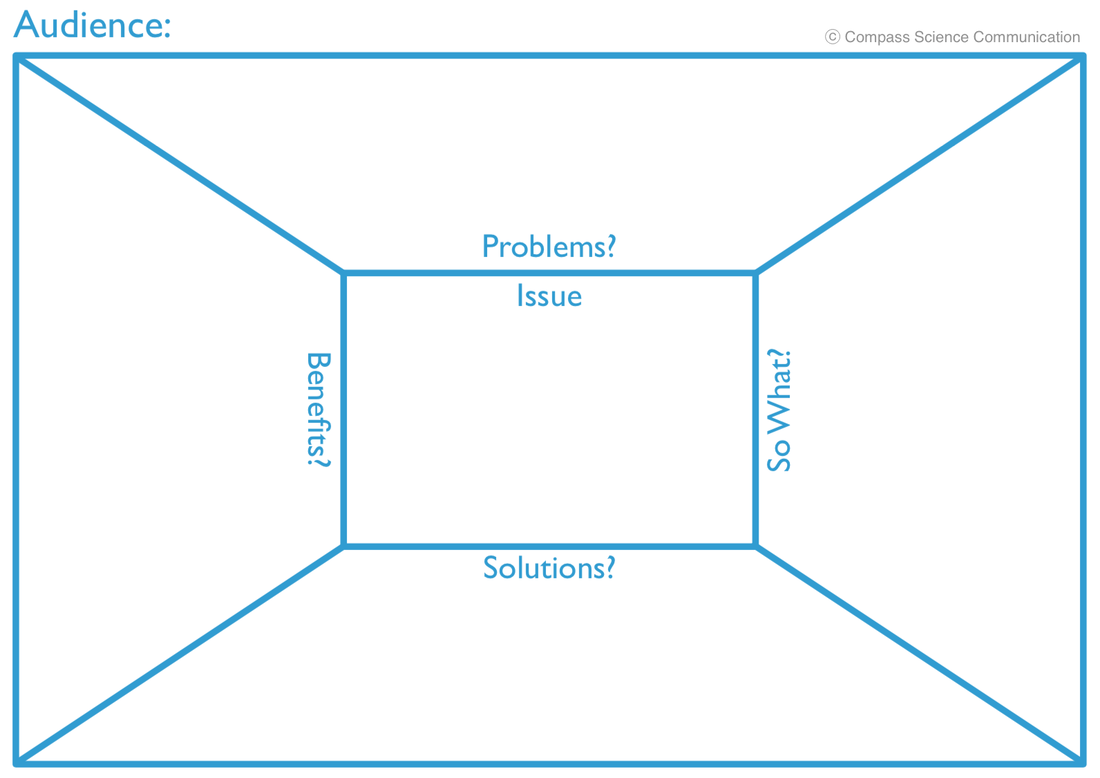


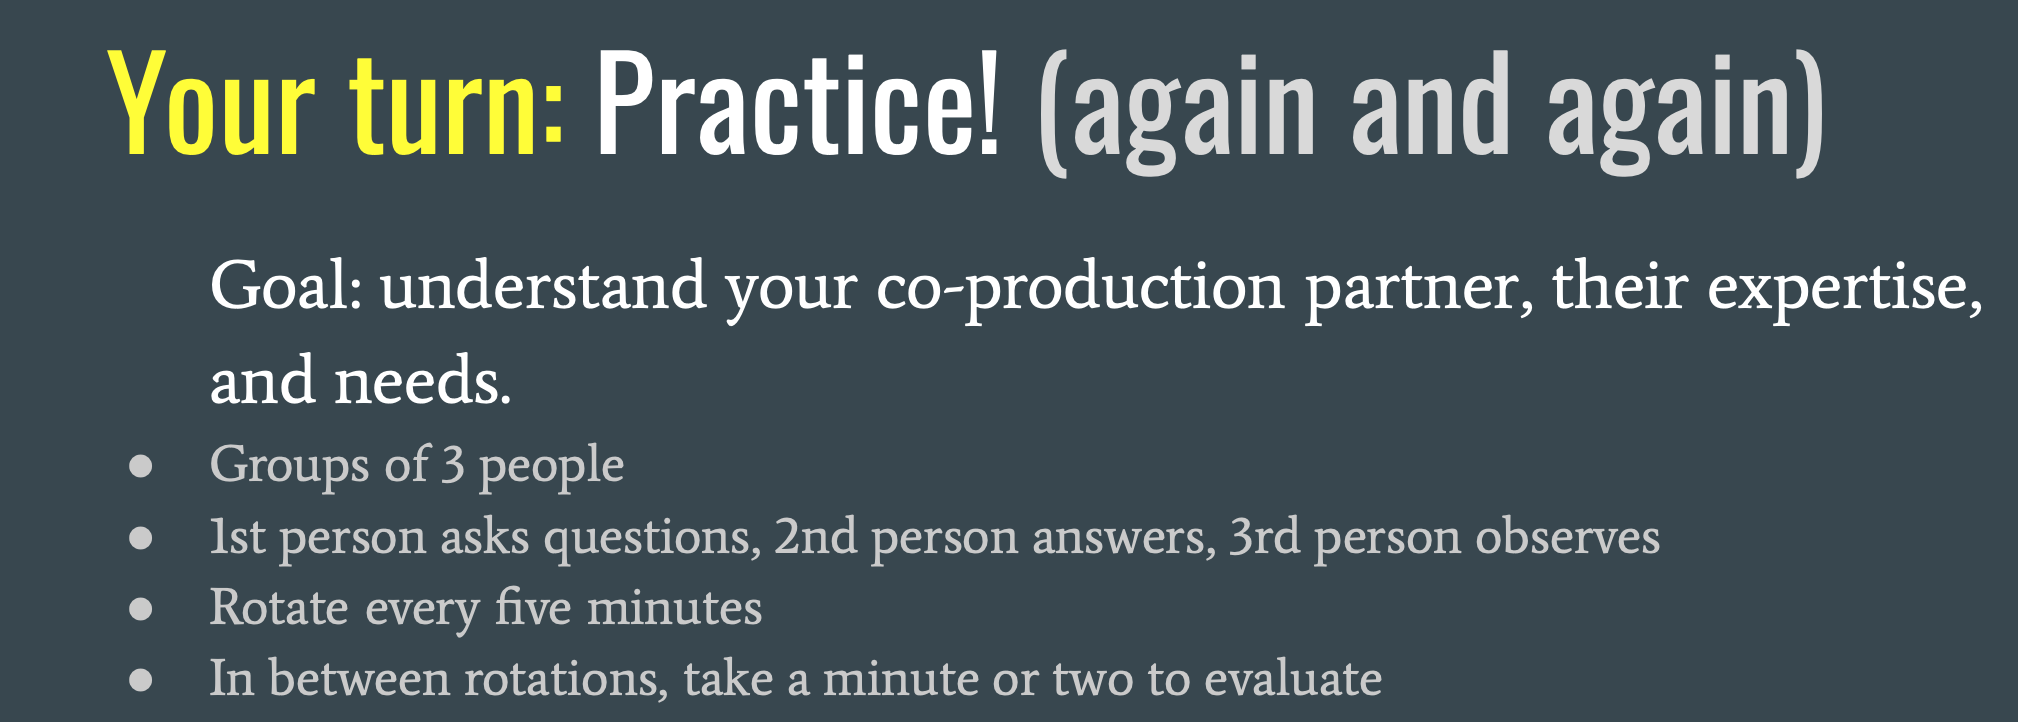

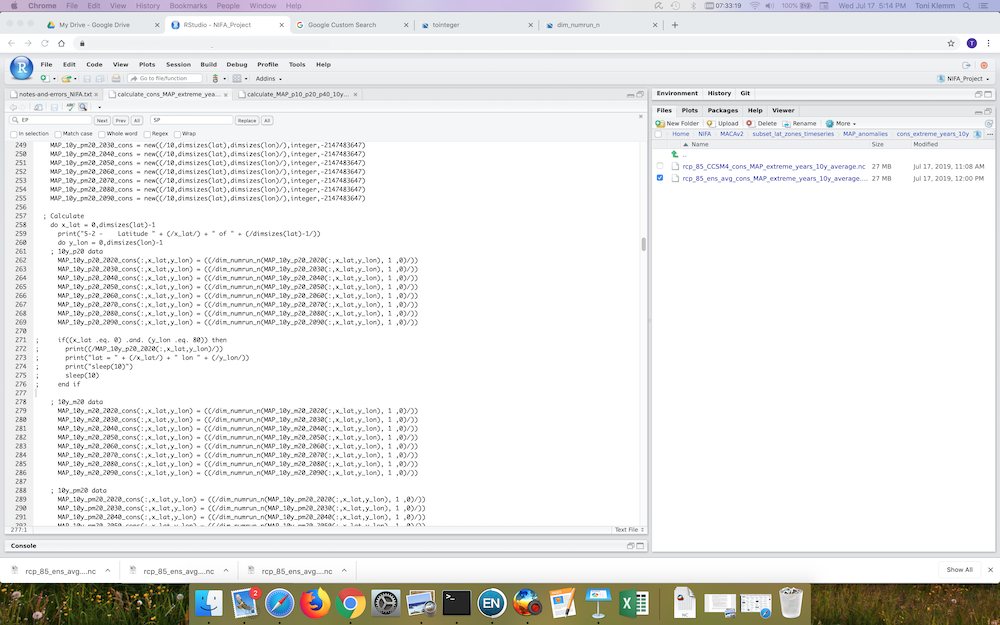
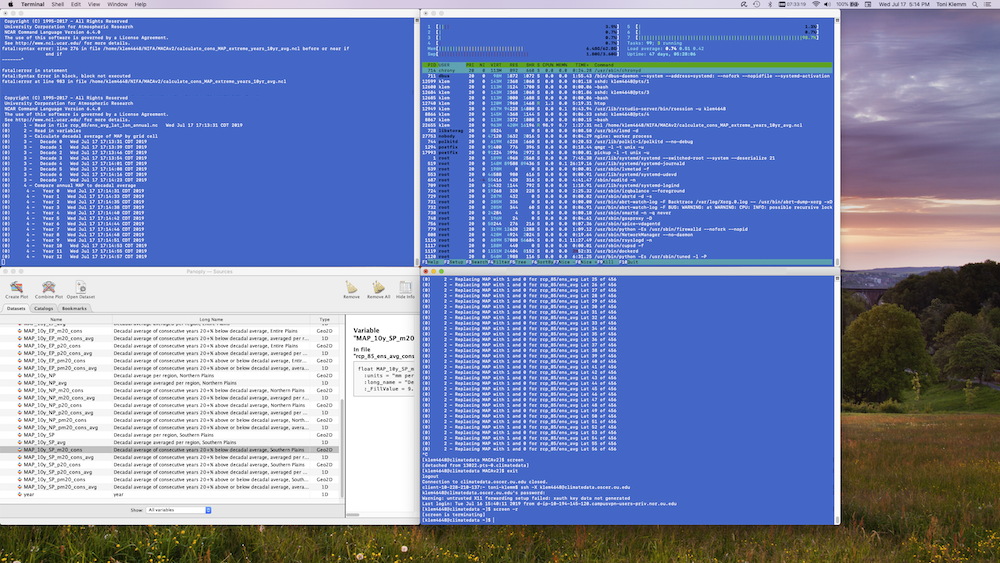
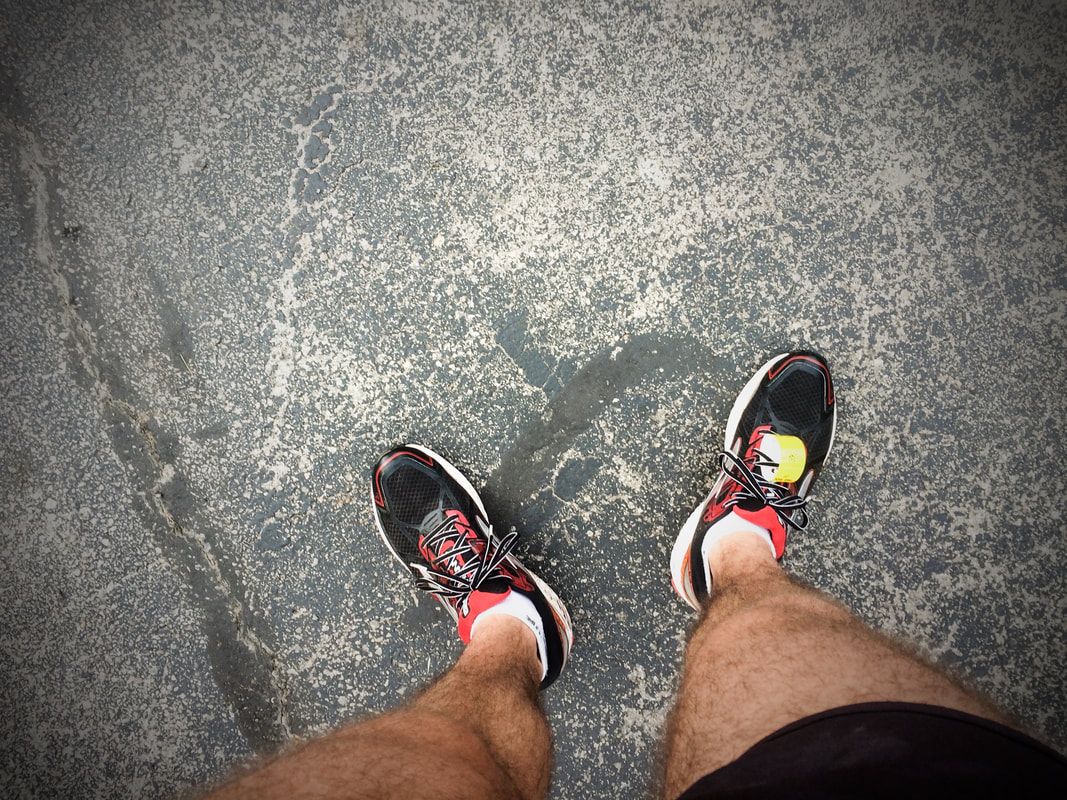
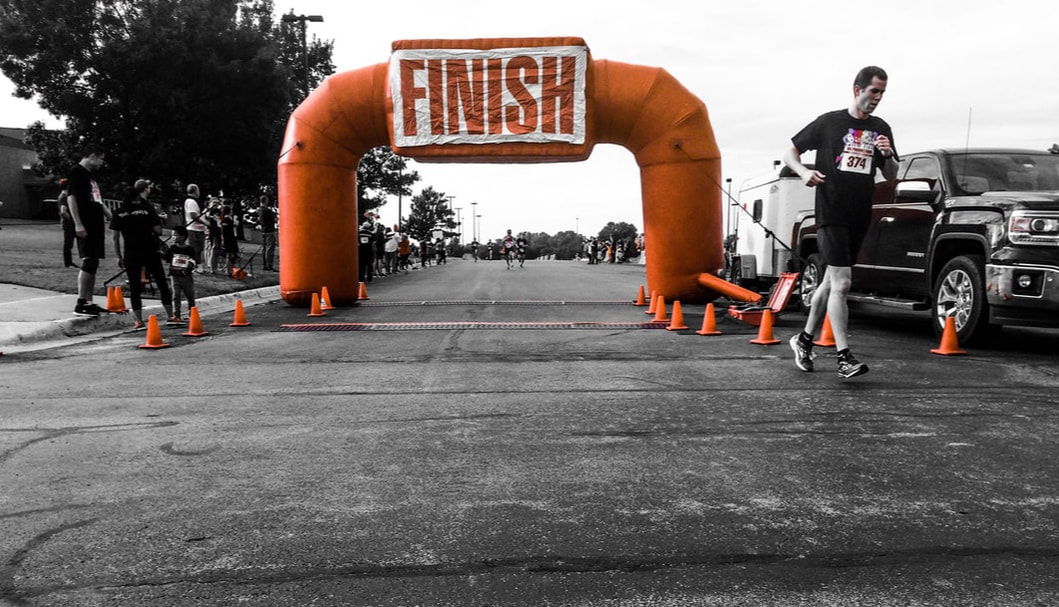
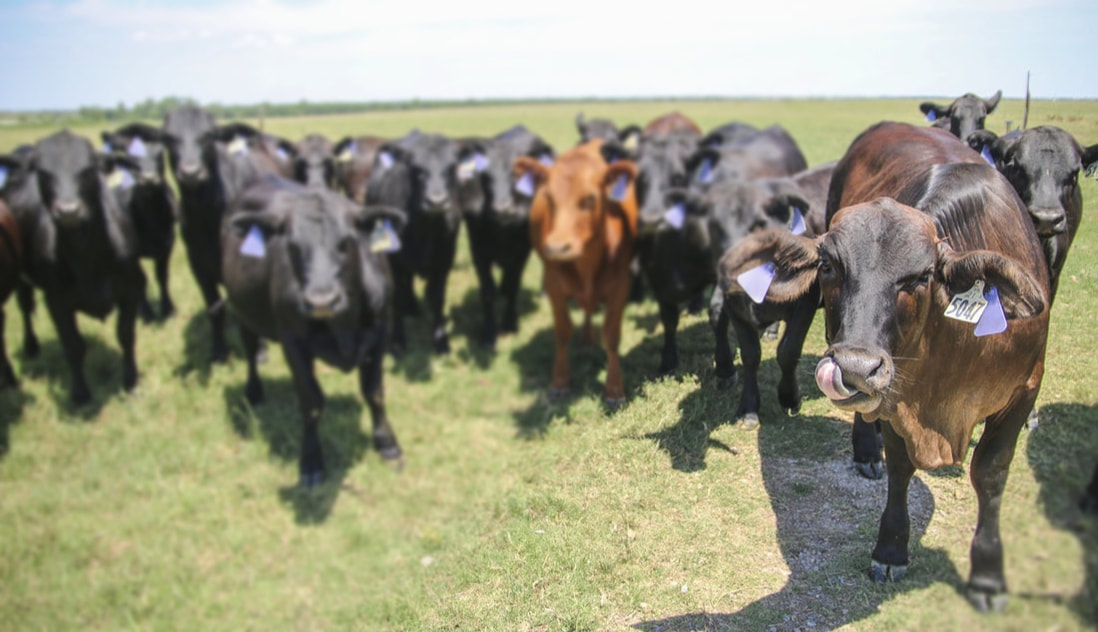
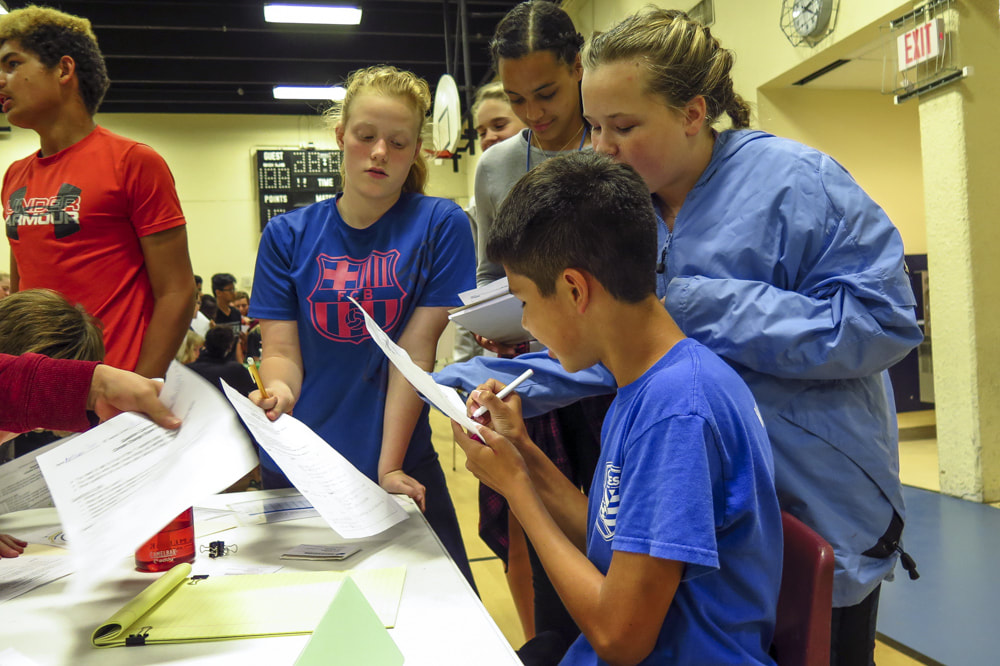
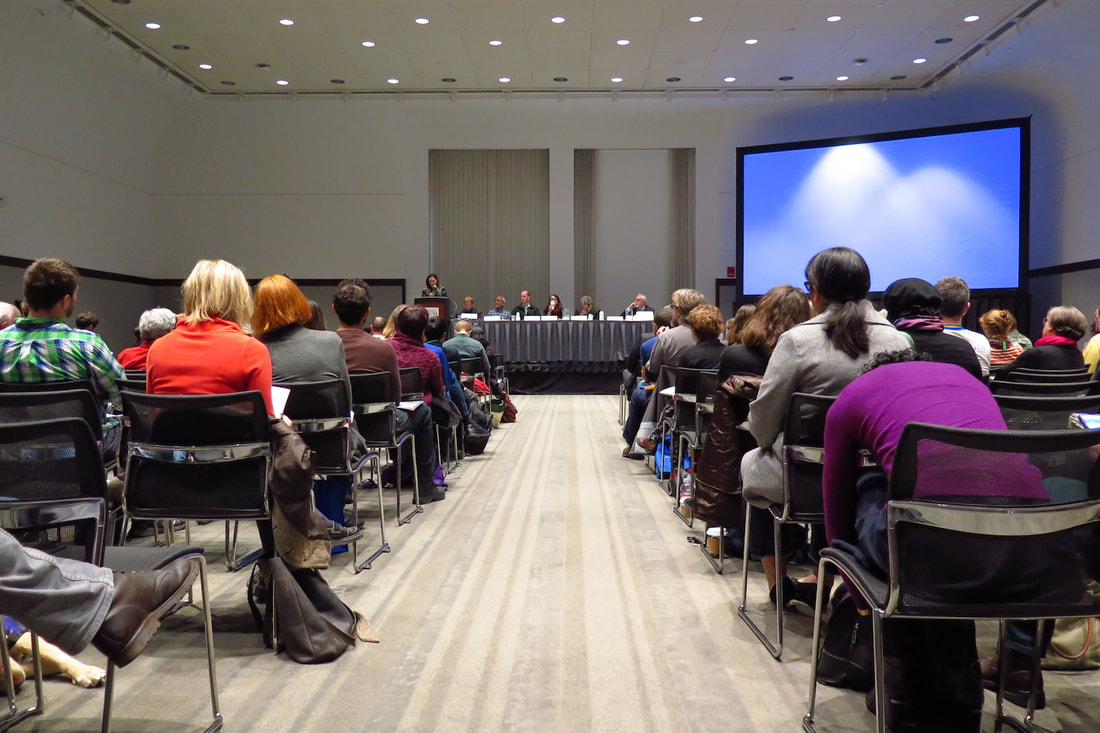
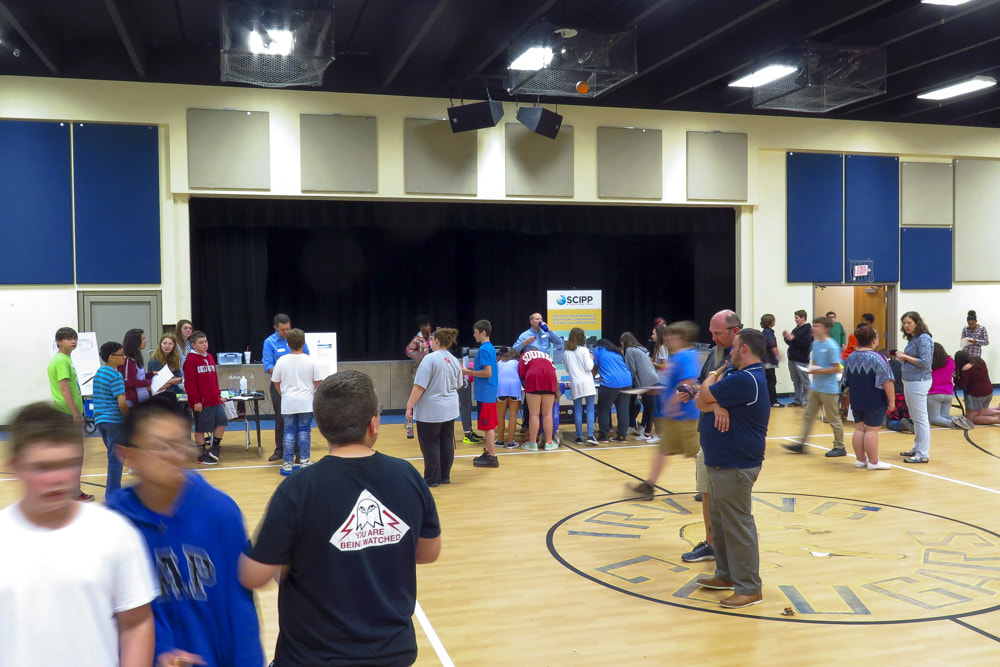
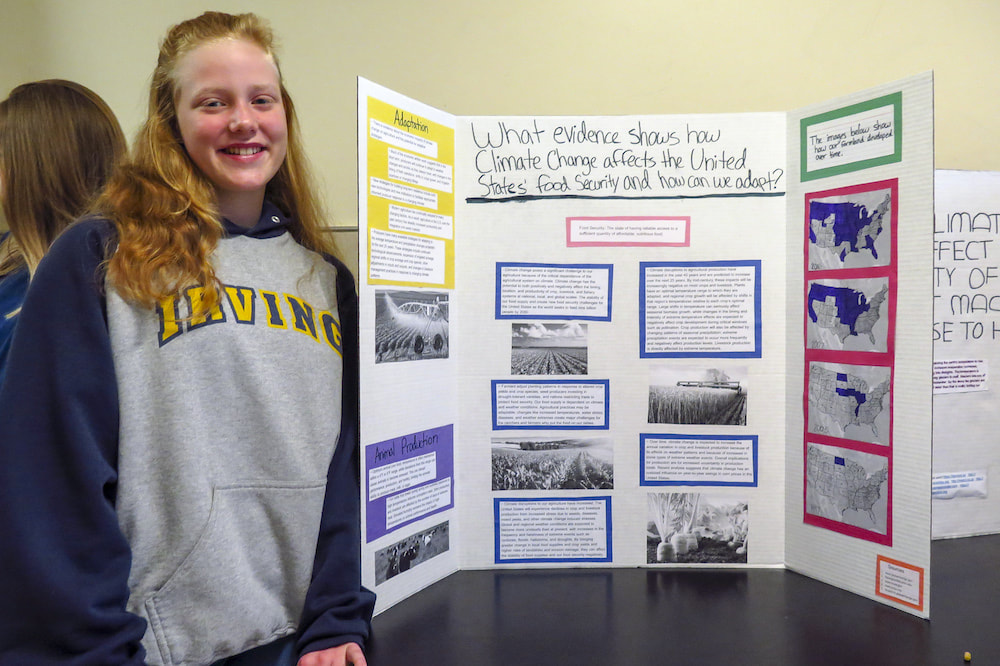
 RSS Feed
